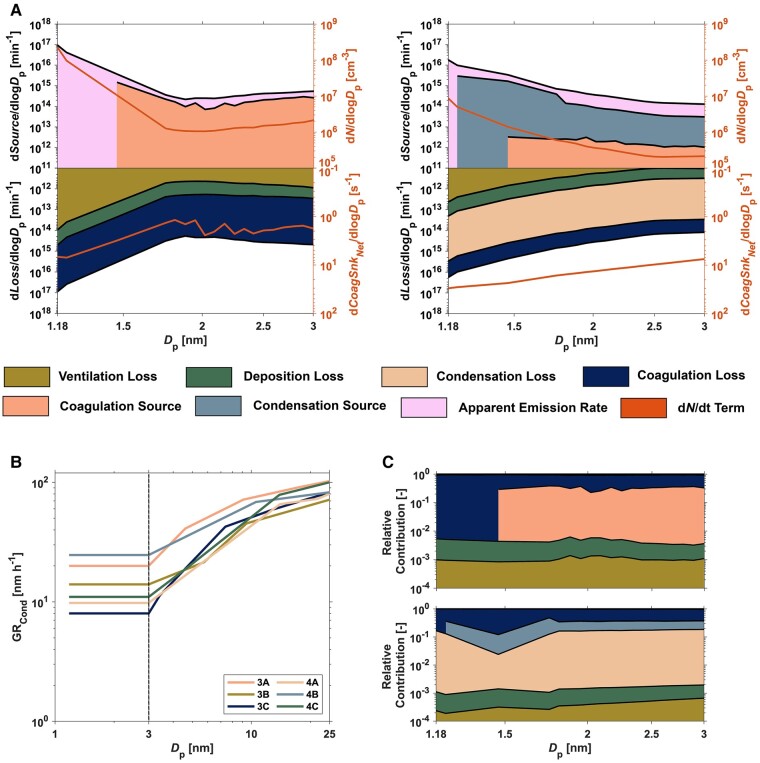
Fig. 3.
Size-resolved evaluation of combustion-derived NCA dynamics in the indoor atmospheric environment during propane gas cooking. A) The apportionment of NCA source terms (apparent emission rate, coagulation source, and condensation source) and NCA loss terms (ventilation loss, deposition loss, coagulation loss, and condensation loss). The coagulation source region in this plot is computed as the product of CoagSrcdp and the volume of the Purdue zEDGE test house. The ventilation loss, deposition loss, coagulation loss, condensation loss, and condensation source are also computed as the product of Eqs. S7, S8, S9, S14 (), and S14 () and the volume of the Purdue zEDGE test house, respectively. These plots also present the cooking-emitted NCA number size distributions and CoagSnkNet for the NCA size fraction. The plot on the left presents the mean values across all small/moderate indoor CoagSnk cases and the plot on the right presents the mean values across all large indoor CoagSnk cases. B) The size-resolved condensational growth rate of particles emitted from butter-based propane-gas-stove cooking in the Purdue zEDGE test house. The values to the right of the dashed line in the plot were computed using the methods described in the Supplementary material, while the values to the left of the dashed line represent a single-value extrapolation down to 1.18 nm. C) Size-resolved relative contribution of each NCA source term, NCA loss term, and the dN/dt term toward calculation of the apparent emission rate aggregated and averaged over the active propane-gas-combustion periods for (top) small/moderate indoor CoagSnk cases and (bottom) large indoor CoagSnk cases. Each y-axis is presented in logarithmic scale. All results for A–C are during the active propane-gas-combustion period of the measurements.

