Figure 1.
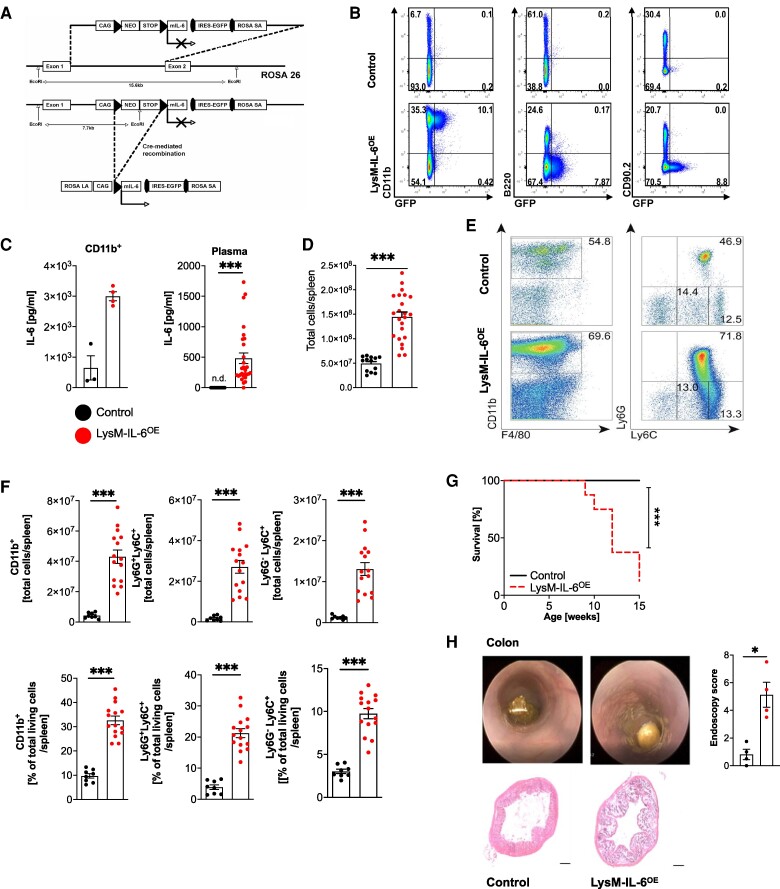
Mice overexpressing interleukin-6 in myeloid cells have an increase in the splenic myeloid cell compartment and a reduced life expectancy. (A) Generation of the IL-6OE allele involved homologous recombination in embryonic stem cells (V6.5). The conditional ‘knock-in’ approach targeted the endogenous gt(ROSA)26Sor locus, introducing a lox-P-flanked transcriptional STOP cassette. Upon Cre-mediated recombination, the cassette was excised, enabling dual expression of interleukin-6 and enhanced green fluorescent protein under the control of the chicken β-actin (CAG) promotor. (B) Flow cytometric analysis of splenocytes from LysM-IL-6OE and control mice. Cells were stained for CD11b, B220, and CD90.2 with gating based on green fluorescent protein signal. Representative plots of n = 4 mice are shown. (C) Interleukin-6 levels in splenocytes and plasma. Left panel: interleukin-6 level in sorted and cultured CD11b+ splenocytes of LysM-IL-6OE mice and control mice. Splenocytes were cultured for 24 h. n = 3–4, Mann–Whitney test. Right panel: interleukin-6 plasma levels in 10-week-old LysM-IL-6OE compared with control mice (n.d. = not detectable). n = 19–28, Mann–Whitney test. P < 0.0001. (D) Statistical analysis of the total living cells per spleen of LysM-IL-6OE and control mice is shown (result of flow cytometric analysis), n = 13–23, Mann–Whitney test. P < 0.0001. (E) Flow cytometric analysis of LysM-IL-6OE and control mice splenocyte subpopulations: after gating out B220+ and CD90.2+ cells, analysis focused on CD11b, F4/80, Ly6C, and Ly6G. Representative plots of n = 8–15 mice are shown. (F) Statistical analysis of the splenic CD11b+ myeloid cells, the Ly6G + Ly6C+ neutrophils, and the Ly6G−Ly6C+ monocytes/macrophages of LysM-IL-6OE and control mice of the flow cytometric experiment above, n = 8–15 mice. Top row: total cells. Bottom row: percentage values of the total living cells, unpaired Student’s t-test. P < 0.0001. (G) Kaplan–Meier survival curve of LysM-IL-6OE vs. control mice, n = 8–16 mice, log-rank (Mantel–Cox) test. (H) Representative image of colon endoscopy (left). Statistical analysis of endoscopy score (right), n = 4, Mann–Whitney test. Bottom part: representative haematoxylin and eosin stainings of the colon of LysM-IL-6OE and control mice. Data are presented as mean ± SEM, and P values of <0.05 were considered significant and marked by asterisks (*P < 0.05; **P < 0.01; ***P < 0.001).

