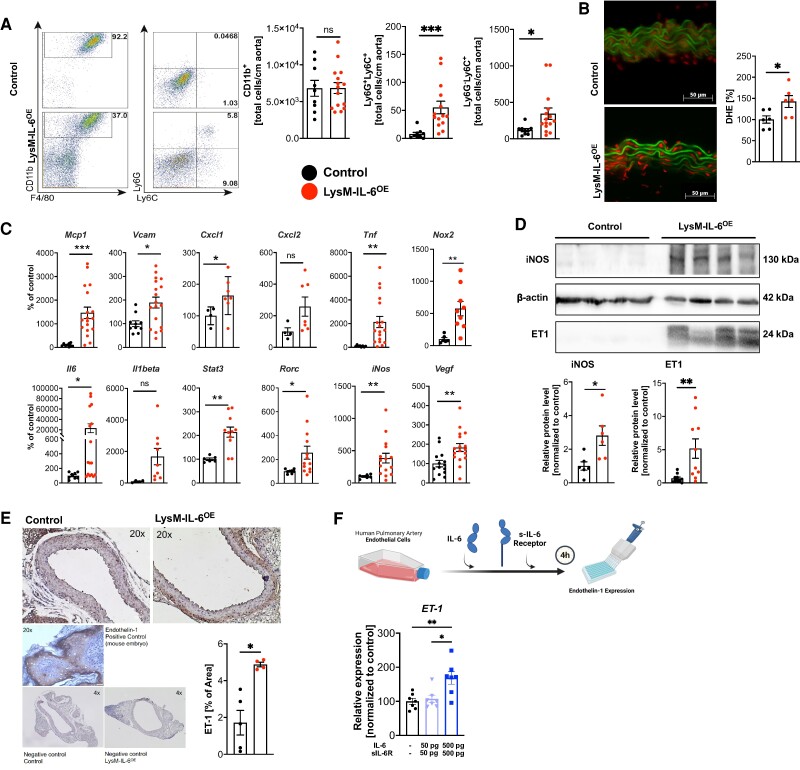
Figure 3.
Interleukin-6-induced vascular dysfunction is based on vascular inflammation combined with an increased endothelin-1 and inducible NO synthase expression. (A) Myeloid cell infiltration in aortas. Representative flow cytometry plots and statistical analysis of myeloid surface staining of aortas from LysM-IL-6OE mice compared with controls and quantification of aortic myeloid cell staining. Pre-gating on living, CD45.2+, and CD11b+ cells. Neutrophils and monocytes were further gated on Ly6G and Ly6C, n = 9–15 mice, either unpaired Student’s t-test or Mann–Whitney test. P = 0.001 (CD11b+ Ly6G+) and P = 0.0101 (CD11b+ Ly6G+). (B) Vascular superoxide formation oxidative fluorescence microtopography of aortic sections. Left: representative image of aortic sections showing lamina autofluorescence (green) and reactive oxygen species formation (red), scale bar = 50 µm. Right: densitometric analysis of vascular superoxide, normalized to control mice per experimental day. n = 6, unpaired Student’s t-test. P = 0.0275. (C) Mcp1 (P < 0.001), Vcam1 (P = 0.01), Cxcl1 (P = 0.0), Cxcl2 (ns), Tnf (P = 0.009), Nox2 (P = 0.005), Il6 (P = 0.01), Il1β (ns), Stat3 (P = 0.002), Rorc (P = 0.02), iNOS (P = 0.005), and Vegf-a (P = 0.005) expression in the aorta of LysM-IL-6OE normalized to control mice. Housekeeping gene: Tbp. n = 5–19, Mann–Whitney test or unpaired Student’s t-test. (D) Representative Western blot and statistical analyses for inducible NO synthase and endothelin-1 normalized to β-actin, n = 6–10, unpaired Student’s t-test. P = 0.0167 (inducible NO synthase) and P = 0.0071 (endothelin-1). (E) Immunohistochemical analysis of endothelin-1 in aortic sections. Left: representative images of endothelin-1 staining of aortic sections with positive and negative controls, scale bar = 50 µm. Right: quantification of the percentage of endothelin-1-positive area. The fatty tissue was excluded. n = 5–4, Mann–Whitney test. P = 0.02. (F) Endothelin-1 expression of human pulmonary arterial endothelial cell co-cultured with IL-6 and sIL-6R for 4 h (quantitative real-time PCR). n = 7, one-way ANOVA test. P = 0.045 (human pulmonary arterial endothelial cell vs. human pulmonary arterial endothelial cell co-cultured with IL-6 and sIL-6R 500pg) and P = 0.0102 (human pulmonary arterial endothelial cell co-cultured with interleukin-6 and sIL-6R 50pg vs. 500pg). Data are presented as mean ± SEM, and P values of <0.05 were considered significant and marked by asterisks (*P < 0.05; **P < 0.01; ***P < 0.001).

