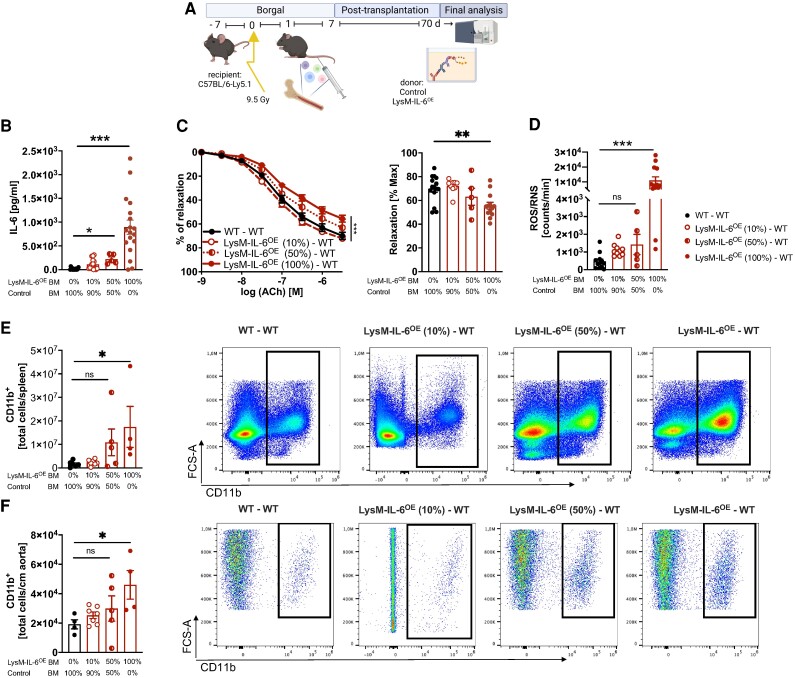
Figure 5.
Bone marrow and blood interleukin-6 levels correlate with systemic and vascular inflammation and dysfunction. (A) Experimental approach of bone marrow transplantation. Schematic representation of the experimental design: different ratios of bone marrow isolated from LysM-IL-6OE mice mixed with bone marrow from control mice (100, 50, and 10%) were transplanted into C57BL6-Ly5.1 mice. The transplantation scenarios included wild-type bone marrow → wild type (black circles), 100% LysM-IL-6OE bone marrow → wild type (red circles completely filled with red colour), and mixed bone marrow consisting of 50% LysM-IL-6OE/50% wild type → wild type (half red circles) or 10% LysM-IL-6OE/90% wild type → wild type (red unfilled circles). Final analysis was conducted 70 days after bone marrow transfer. (B) Interleukin-6 levels in serum were measured by ELISA and Bioplex analysis in the bone marrow chimeric mice. n = 12–13, Kruskal–Wallis test with comparison of the mean of each column to the 100% control bone marrow column. P = 0.0245 (100% control bone marrow vs. 50% LysM-IL-6OE bone marrow) and P < 0.0001 (100% control bone marrow vs. 100% LysM-IL-6OE bone marrow). (C) Left: isometric tension studies of isolated aortic rings of bone marrow chimeric mice in response to acetylcholine. n = 5–16 mice/group, two-way ANOVA, Bonferroni’s multiple comparison. P < 0.0001 (comparison of the endpoint of the aortic relaxation curves of 100% control bone marrow vs. 100% LysM-IL-6OE bone marrow). Right: comparison of the maximal relaxation of the aortic relaxation curves in response to acetylcholine shown on the left-hand side. P = 0.003 (comparison of the maximum relaxation of the aortic relaxation curves of 100% control bone marrow vs. 100% LysM-IL-6OE bone marrow). (D) Reactive oxygen species/reactive nitrogen species measurement in blood after 20 min stimulation with phorbol 12,13-dibutyrate in bone marrow chimeric mice, n = 5–14, Kruskal–Wallis test with comparison of the mean of each column to the 100% control bone marrow column. P < 0.001 (100% control bone marrow vs. 100% LysM-IL-6OE bone marrow). (E) Flow cytometric analysis of the CD11b+ cells in the spleen of bone marrow chimeric mice. n = 4–7 mice/group, Kruskal–Wallis test with comparison of the mean of each column to the 100% control bone marrow column. P = 0.0134 (100% control bone marrow vs. 100% LysM-IL-6OE bone marrow). (F) Flow cytometric analysis of the CD11b+ cells in the aorta of bone marrow chimeric mice. n = 4–7 mice/group, Kruskal–Wallis test with comparison of the mean of each column to the 100% control bone marrow column. P = 0.0215 (100% control bone marrow vs. 100% LysM-IL-6OE bone marrow). Data are presented as mean ± SEM, and P values of <0.05 were considered significant and marked by asterisks (*P < 0.05; **P < 0.01; ***P < 0.001).

