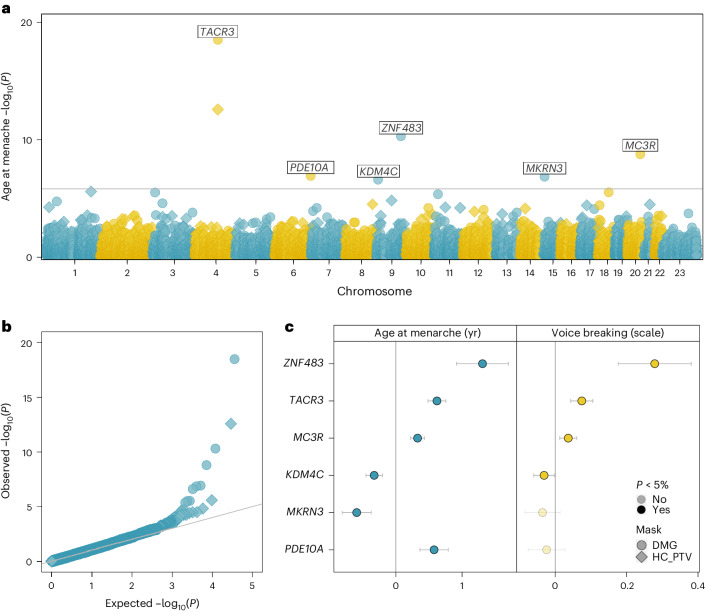
Fig. 2. Exome-wide rare variant burden associations with AAM.
a, Manhattan plot showing gene burden test results for AAM. Six genes passing exome-wide significance (P < 1.54 × 10⁻⁶) are highlighted. Point shapes indicate variant-predicted functional class (DMG; damaging). b, Quantile–quantile (QQ) plot for gene burden tests. c, Comparison of gene burden associations (effect sizes with 95% CIs) for AAM (female participants, in years, n = 222,283) and AVB (male participants, in three categories, n = 178,625). Relevant data are included in Supplementary Table 5.

