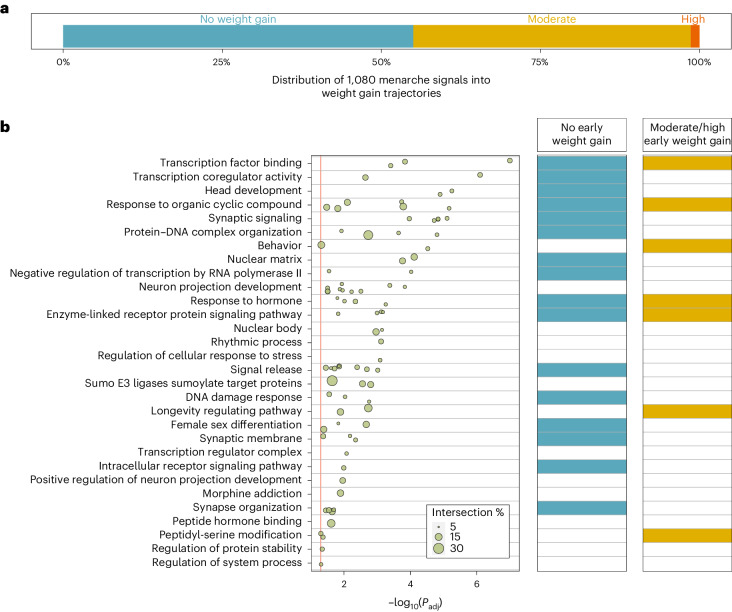
Fig. 4. Stratification of AAM signals and biological pathway enrichment by their influence on early childhood weight.
a, Proportion of GWAS signals for AAM by early childhood weight trajectory. b, Biological pathways enriched for high-confidence AAM genes (left), plus enrichment within early childhood weight trajectories (right). Pathway enrichment was calculated using g:Profiler, and the displayed P values are Bonferroni-corrected. Row names describe pathway clusters. Strength of associations with individual pathways is indicated by circles. Circle size reflects the proportion of pathway genes that are high-confidence AAM genes (in percentage). Right, determining whether each pathway cluster remains enriched for AAM genes when stratified by early childhood weight trajectory. Supporting data are included in Supplementary Tables 21 and 23–26.

