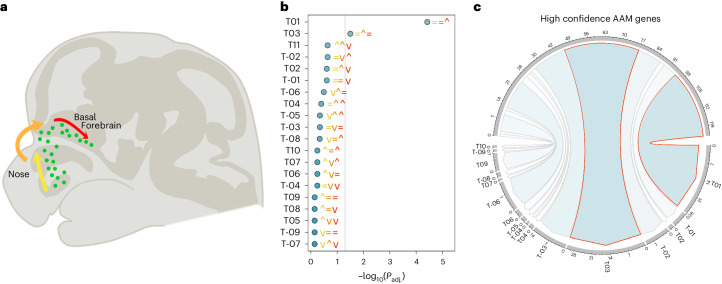
Fig. 5. Enrichment of gene drivers of GnRH migration and maturation in the AAM GWAS.
a, Schematic representation of the stages of GnRH neuron migration during embryonic development. Using RNA-seq data, Zouaghi et al.57 grouped differentially expressed genes into 23 expressional trajectories based on their comparative level of expression during the early (yellow), intermediate (amber) and late (red) stages of GnRH migration. b, Genome-wide MAGMA enrichment for AAM gene associations within each expression trajectory. Colored symbols accompanying the points indicate the expression level of genes within each trajectory at the three aforementioned stages of migration; that is, the first yellow symbols indicate whether gene expression remains the same (=), is upregulated (^) or downregulated (v) in the early stage of migration. Orange and red symbols denote the same for the intermediate and late stages of migration, accordingly. c, Trajectories significantly (Padj < 0.05) enriched at the genome-wide level in b are highlighted in red and also show significant (P < 0.05) overlap with the 665 high-confidence AAM genes. Supporting data are included in Supplementary Tables 18 and 27.

