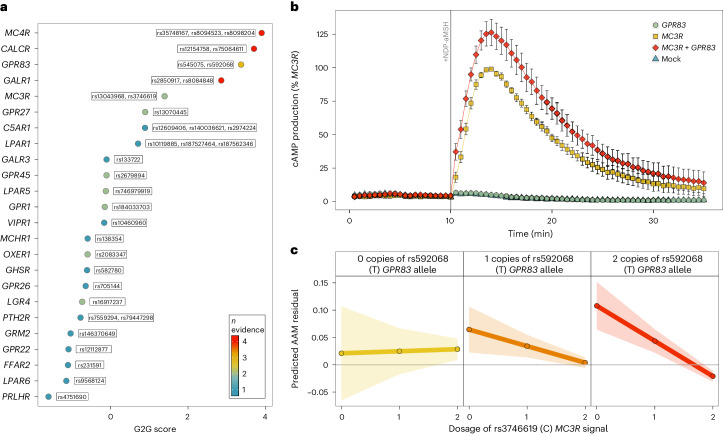
Fig. 6. Interactions between GPCRs on AAM.
a, A total of 24 brain-expressed GPCRs were implicated in AAM by the G2G analysis of the white European GWAS data. Point colors indicate the number of concordant G2G predictors implicating each GPCR. b, Time-resolved NDP-αMSH-stimulated cAMP production in HEK293 cells expressing MC3R-alone or with both MC3R and GPR83. Data are presented as the mean (±s.e.) percentage of the maximal MC3R-alone response (from six independent experiments). c, AAM according to dosage of MC3R function-increasing C alleles at rs3746619 (x axis in each panel) and GPR83 expression-increasing T alleles at rs592068. Predicted means are represented by the lines, and the accompanying 95% CIs are denoted by the shaded areas. βinteraction = −0.034 ± 0.015 years, Pinteraction = 0.02. Supporting data are included in Supplementary Tables 28 and 30.

