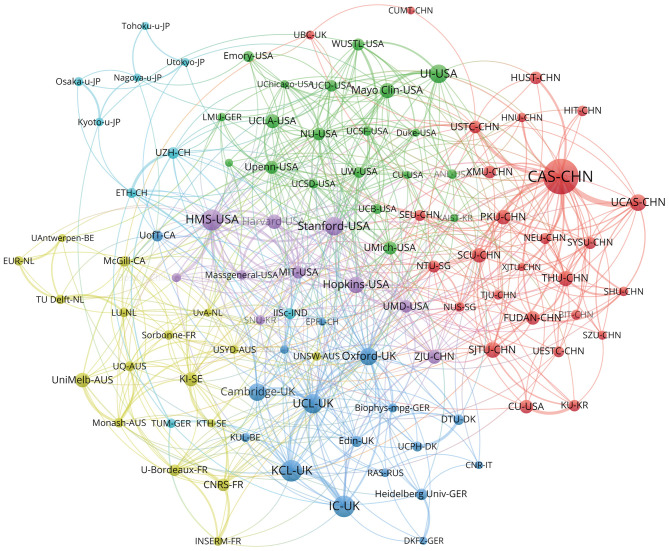
Figure 4.
Cooperation network of institutions. Analysis of the graph’s clustering reveals a higher level of intracountry cooperation among institutions. A location at the border between groups represents more international or intergroup collaboration, while a location within a group represents domestic or intragroup collaboration. The circle size represents the publication volume, while the line thickness represents a research connection between two institutions based on their co-authorship status. The various colors represent different cooperation clusters, and institutions grouped within the same cluster may possess greater potential for collaborative relationships.

