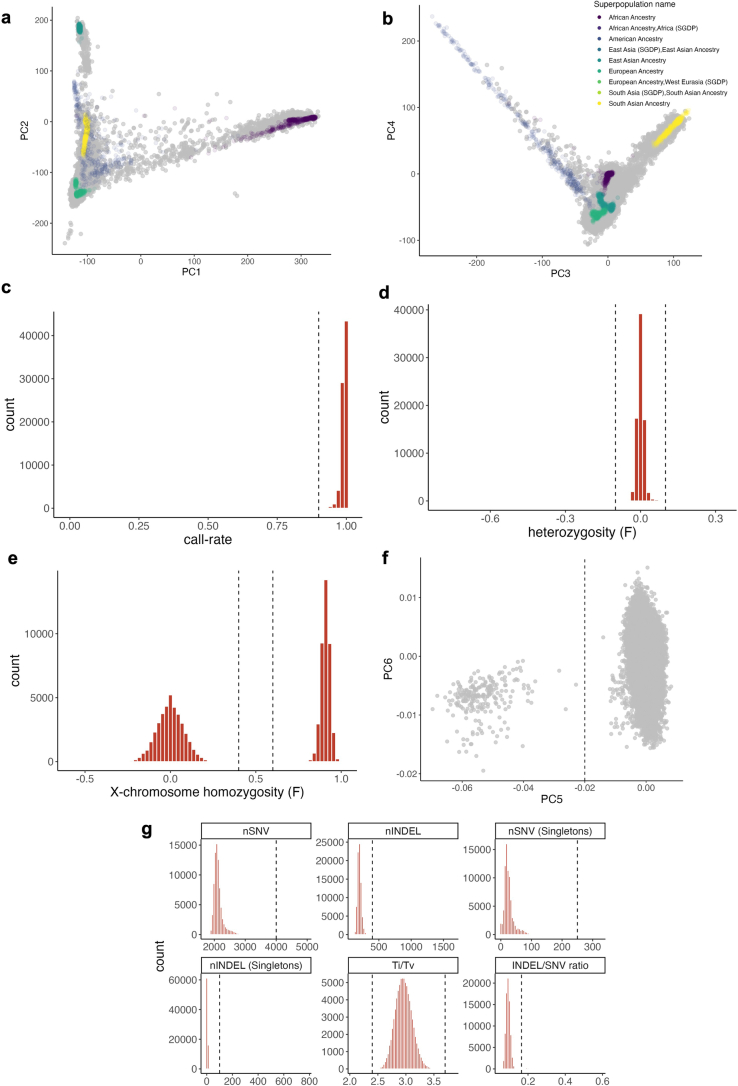
Extended Data Fig. 2. Sample QC.
a,b, Projection of all samples onto PCA coordinates of a reference ancestry space comprising 1000 Genomes samples. Grey dots indicate the 81,507 samples included in this study. Colored dots indicate the 1000 Genomes samples, colored by superpopulation label, onto which the study samples were projected. c, Sample call-rate distribution. Samples with a call-rate < 0.9 were excluded. d, Heterozygosity. Samples with F < − 0.1 or F > 0.1 were excluded. e, X-chromosome homozygosity. Samples with ambiguous sex (0.4 < F < 0.6) or where genetically predicted sex did not match reported sex were excluded (F < 0.4 = female; F > 0.6 = male). f, Principal component analysis (PCA). A distinct cluster was identified on the fifth principal component, samples with PC5 < −0.02 were excluded. g, Total variant count distributions. Samples were excluded if nSNV > 4000, nINDEL > 400, nSNV (Singletons) > 250, nINDEL (Singletons) > 100, Ti/Tv ratio < 2.4 or > 3.7 or INDEL/SNV ratio > 0.165.

