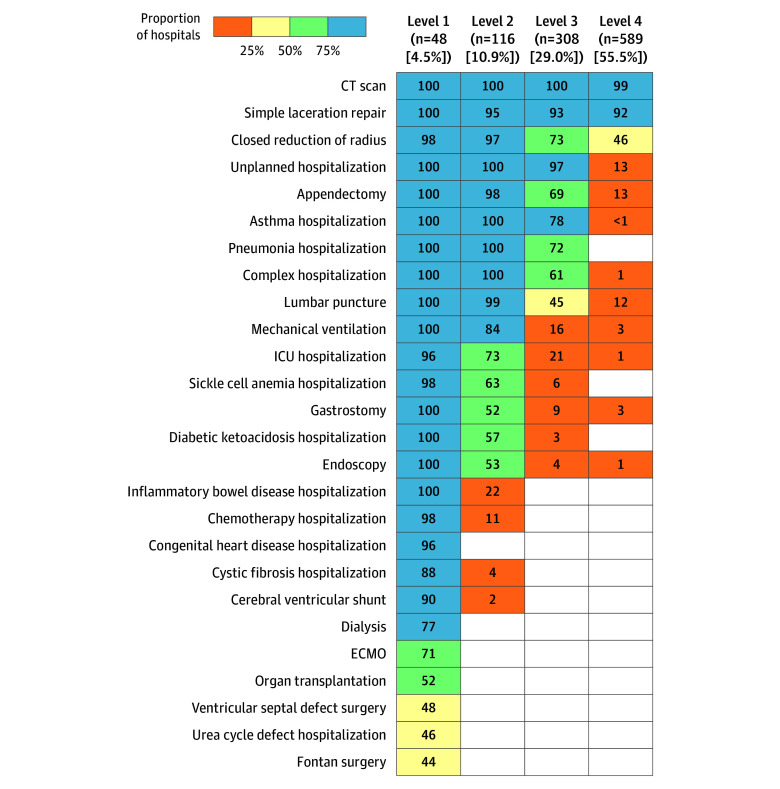
Figure. Hospital Functional Capabilities by Level.
Percentages of hospitals by functional level that had each capability, as defined by performing a procedure 3 or more times in 2019 (blue, ≥75%; green, 50% to <75%; yellow, 25% to <50%; orange, >0% to <25%; white, 0%). Functional levels were determined using latent class analysis. CT indicates computed tomography; ECMO, extracorporeal membrane oxygenation; and ICU, intensive care unit.

