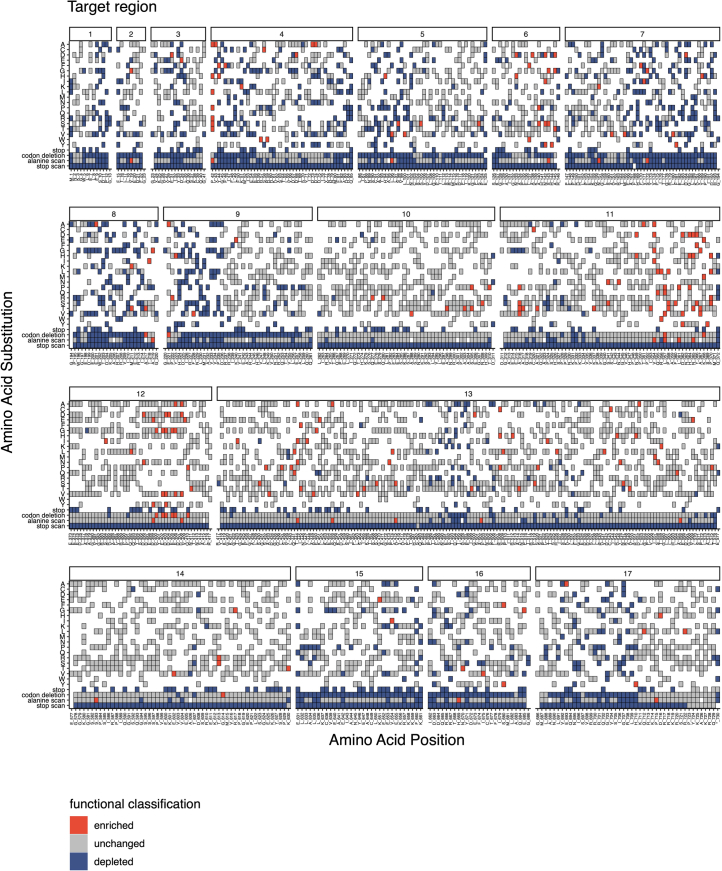
Extended Data Fig. 6. Amino acid-level map of BAP1 variant effect.
Heat map to show functional classification for protein-level changes. This includes missense changes created by SNVs, alanine scan, stop scan and codon deletions. Synonymous substitutions are also shown. Distinct regions of mutational intolerance can be seen. Stop-gained variants that do not significantly deplete can be seen in 7 terminal codons of exon 17. Non-depleting stop-gained variants generated through the ‘stop scan’ function (NNN>TGA) are also seen at K630 in exon 14 and S482 in exon 13, however SNVs leading to stop-gained mutations (NNN>TAG) do deplete at these loci. White space is due to either low-count filtering at the QC stage, because SNV level saturation does not produce all amino acid level substitutions, or because redundant SNVs for the same missense change resulting in discordant functional classifications were removed in this plot (n=158).

