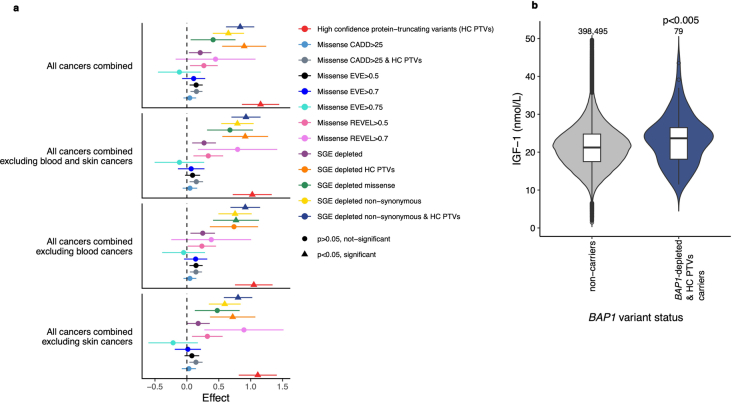
Extended Data Fig. 8. UKBB rare variant burden masks across cancer types and IGF-1 levels are increased in UKBB BAP1 HC PTVs.
a. Rare variant burden test masks shown by colour for BAP1 variants in UKBB across cancer phenotype masks. The significance was calculated according to corrected p-value determined by generalized linear modelling (see Supplementary Method 14), is signified by triangle (significant) or circle (not significant). In order to make comparisons, we also created masks separate from SGE-depletion, including; all BAP1 HC PTVs in UKBB (red), BAP1 missense variants with CADD scores > 25 (light blue) and BAP1 HC PTVs plus missense variants with CADD scores > 25 (grey), missense with EVE score>0.75/>0.7/>0.5 (very high (cyan), high (royal blue), and moderate pathogenicity (black) bins, respectively), and REVEL score>0.7/>0.5 (high (light pink) and moderate (dark pink) pathogenicity thresholds, respectively). Significance and effect differ between cancer types. For all cancers, SGE depleted non-synonymous variants (yellow) show a significant effect and are therefore associated with an increased cancer risk. No in silico tools assessed allow for a significant association with cancer to be achieved, most notably in ‘All cancers combined excluding blood’, where SGE depleted missense (green) are significantly associated with cancer, allowing for direct comparison with missense only prediction. The number of carriers for each rare variant burden test mask in each cancer phenotype mask can be seen in Supplementary Table 7. Error bars define the +/- standard error of the regression model effect. b. UKBB BAP1 HC PTV variant carriers combined with SGE-depleted non-synonymous variant carriers (total n=79 out of 96 carriers, shown in Supplementary Table 7, have IGF-1 values) have a significantly higher median blood concentration of Insulin-like Growth Factor 1 (IGF-1) compared to non-carriers (n=398,495), p=0.004 (two-sided Mann-Whitney-Wilcoxon Test). Violin plot coloured by BAP1 variant status for clarity. Box shows interquartile range, horizontal line the median IGF-1 blood concentration (nmol/L), whiskers show maximum and minimum values that are not outliers, outliers as circles.

