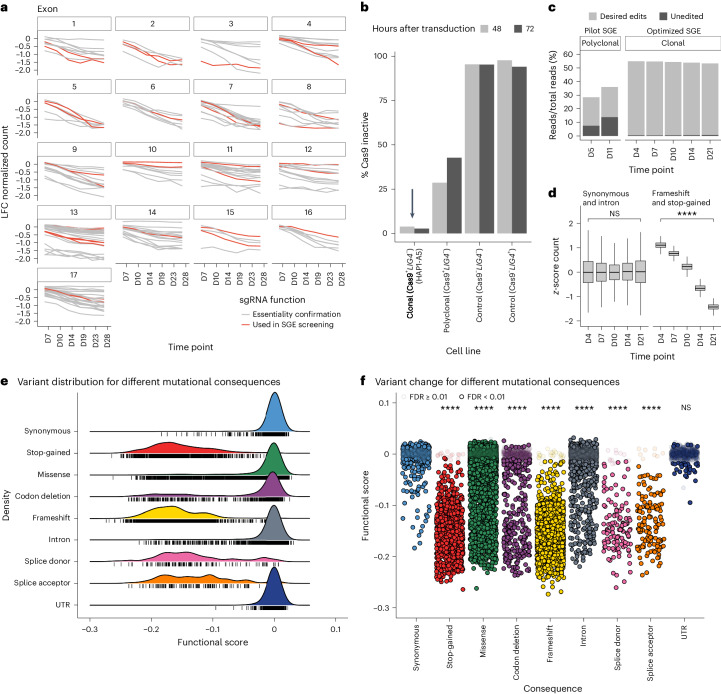
Fig. 2. Cell fitness/essentiality using optimized SGE reports the mutational consequences of editing of the BAP1 locus.
a, A targeted CRISPR−Cas9 screen in HAP1-A5 cells confirmed BAP1 essentiality and permitted selection of sgRNAs with favorable depletion kinetics for use in SGE (Methods). b, FACS analysis counts (green fluorescent protein (GFP)-positive cells) demonstrated that the HAP1-A5 clone has very high Cas9 activity (arrow), measured at 48 and 72 h after transduction with a GFP/blue fluorescent protein (BFP) activity construct (Methods: ‘Ploidy and FACS analysis’), compared to the parental ‘Polyclonal (Cas9+ LIG4−)’ line. A total of 10,000−20,000 cells were analyzed for each line. Cell count percentages derived from negative-control lines with no Cas9 showed expected low levels of Cas9 activity (see Extended Data Fig. 1a and Supplementary Fig. 1a for representative FACS data). c, Editing using pilot SGE conditions: a template library (496 variants) coupled with sgRNA-A targeting exon 5 of BAP1 was transfected into the polyclonal (Cas9+ LIG4−) line and cells were sampled at D5 and D11 (time points previously10 used in SGE). More than 10% of the counts were unedited (wild type), which decreased to <1% when the clonal (Cas9+ LIG4−) cell line (HAP1-A5) was edited using the same sgRNA and HDR homology arms with optimized SGE conditions, including a high-complexity template library (1,040 variants) sampled over five time points. d, Count abundance for variants that resulted in synonymous changes or edited intronic regions did not change significantly over a 21-day SGE screen (two-sided Mann−Whitney–Wilcoxon test; D4 versus D21 counts, P = 0.3; NS, not significant), whereas variants resulting in stop-gained and frameshift consequences were significantly depleted (****P < 2.2 ⨯ 10−16; n = 8,707 synonymous and intronic variants; n = 5,628 frameshift and stop-gained variants; mean z-score counts of three biological replicates at each time point). Boxes show the interquartile range, the horizontal lines show the median z-score count and whiskers show the maximum and minimum values that are not outliers. e, Density plot showing functional scores colored by Ensembl Variant Effect Predictor (VEP)53 mutational consequence. Black tick marks represent single variant values. f, Jitter plot showing VEP mutational consequence categories versus functional score. Data points that have FDR ≥ 0.01 are semitransparent and the median synonymous functional score differs significantly from that for all other categories except UTR (Kruskal−Wallis test: P < 2.2 ⨯ 10−16, H = 6,692.2; two-sided Dunn’s BH FDR ****q < 2.2 ⨯ 10−16).

