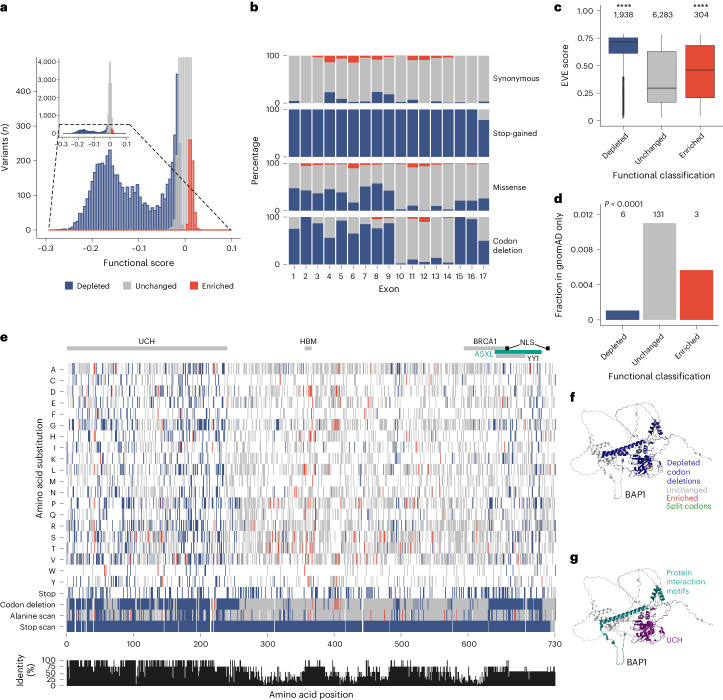
Fig. 3. Functional classification of BAP1 variants.
a, Histogram showing all 18,108 unique variants assayed, grouped into 75 intervals and colored according to functional classification. Inset shows a magnified section of functional score intervals with ≤500 variants. b, Composition of functional classes by exon and mutational consequence (color key as in a). c, EVE scores for functional classes (n variants in class shown). Both depleted and enriched classes have significantly different median values from the unchanged class (Kurskal−Wallis, P < 2.2 ⨯ 10−16; two-sided Dunn’s BH FDR, ****q < 0.0001; depleted q < 2.2 ⨯ 10−16 and enriched q = 3.4 ⨯ 10−5), demonstrating that depleted and enriched variants are less represented over evolution compared to unchanged variants and are therefore more likely to be disruptive. Boxes show the interquartile range, horizontal lines show the median EVE score, whiskers show maximum and minimum values that are not outliers, and outliers are shown as points. d, The bar chart shows the number of variants in each class that are in gnomAD and not ClinVar (n shown) divided by the number of variants in each class assayed. Fewer depleted and enriched variants than unchanged variants were observed in gnomAD (two-sided chi-squared test: χ2 = 49.1, P < 2.14 ⨯ 10−11). e, Heat map showing amino acid-level substitutions (‘A’:‘stop’) created by nucleotide-level saturation across 730 codons (single nucleotide variants (SNVs) only), colored by functional classification (SNV missense changes with discordant functional classifications between alternative codons were excluded; n = 158). Of note, ‘codon deletion’, ‘alanine scan’ and ‘stop scan’ changes were designed to be incorporated at each of the 720 nonsplit codons (of 730 total codons). Bar chart shows the percentage identity calculated from Geneious alignment of the eight species shown in Fig. 6d. Key protein regions are shown (UCH, ubiquitin C-terminal hydrolase; HBM, HCF1 binding motif; BRCA1, BRCA1 binding domain; ASXL, additional sex combs like 1/2/3 interaction; YY1, Ying Yang 1 binding domain; NLS, nuclear localization signal). f,g, AlphaFold54 BAP1 model with SGE-depleted codon deletions colored dark blue (f). Depleted codon deletions accurately delineate the UCH domain (purple) and protein interaction region (cyan), as highlighted in g. Depletion also occurs in uncharacterized regions, including the α-helix C terminal to the UCH domain, proximal to the protein interaction region (arrow, f).

