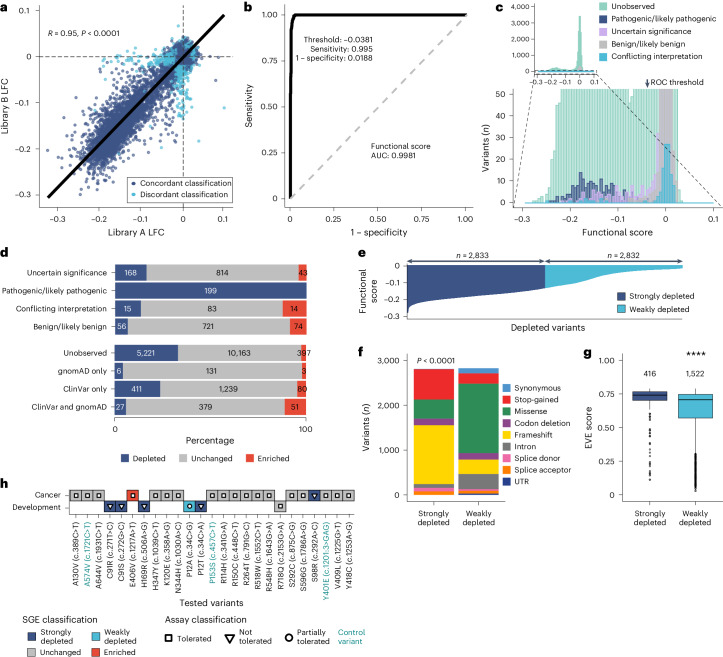
Fig. 4. SGE data are technically robust and provide highly accurate clinical classification.
a, Independent SGE libraries (A and B) were used to edit most target regions with 13,106 of 14,624 variants showing a concordant functional classification (dark blue) and 1,518 variants discordant between libraries (light blue). Of note, the degrees of LFC for each independent variant measurement were highly concordant based on Pearson’s correlation coefficient (R) and two-tailed t-test P < 2.2 ⨯ 10−16. b, ROC curve for SGE functional score, with AUC value shown. Also shown is the ideal threshold for maximum diagnostic sensitivity and specificity (plotted as ‘1 − specificity’). Calculated using pROC (version 1.18.4)55 in R. c, Top, a histogram showing the 18,108 unique variants grouped within 75 intervals of functional score, colored by ClinVar clinical significance. Bottom, a magnified region highlights that pathogenic/likely pathogenic (dark blue) variants are depleted. The arrow shows the x-axis position of the ideal threshold. d, Top, functional classification by ClinVar clinical significance (≥1*, 4 September 2023). Bottom, functional classification by observation in ClinVar and gnomAD (n variants shown). e, Depleted variants (n = 5,665) categorized into strongly depleted (lower 50%, dark blue) and weakly depleted (upper 50%, light blue) variants, either side of the median functional score (−0.1260642). f, More frameshift and stop-gained variants and fewer missense variants were strongly depleted compared to weakly depleted variants (two-sided chi-squared test, χ2 = 10,759, P < 2.2 ⨯ 10−16). g, Strongly and weakly depleted missense variants have significantly different EVE scores (two-sided Mann−Whitney−Wilcoxon test, ****P < 2.2 ⨯ 10−16). Boxes show the interquartile range, horizontal lines show the median EVE score, whiskers show maximum and minimum values that are not outliers, and outliers are shown as points. h, Concordance of SGE functional classification and orthogonal functional assays for VUS in patients with cancer and developmental disorders9,25. Color indicates SGE classification and shape corresponds to orthogonal assay classification. Control variants (from a case−control study25) are shown in green text. SGE variants that were strongly depleted (dark blue) and not tolerated in orthogonal assays (triangles) are completely concordant. P12A, which was partially tolerated in an orthogonal assay, was weakly depleted in SGE. All tolerated variants (white squares) in assays were unchanged in SGE (gray), except for E406V, which was enriched (red).

