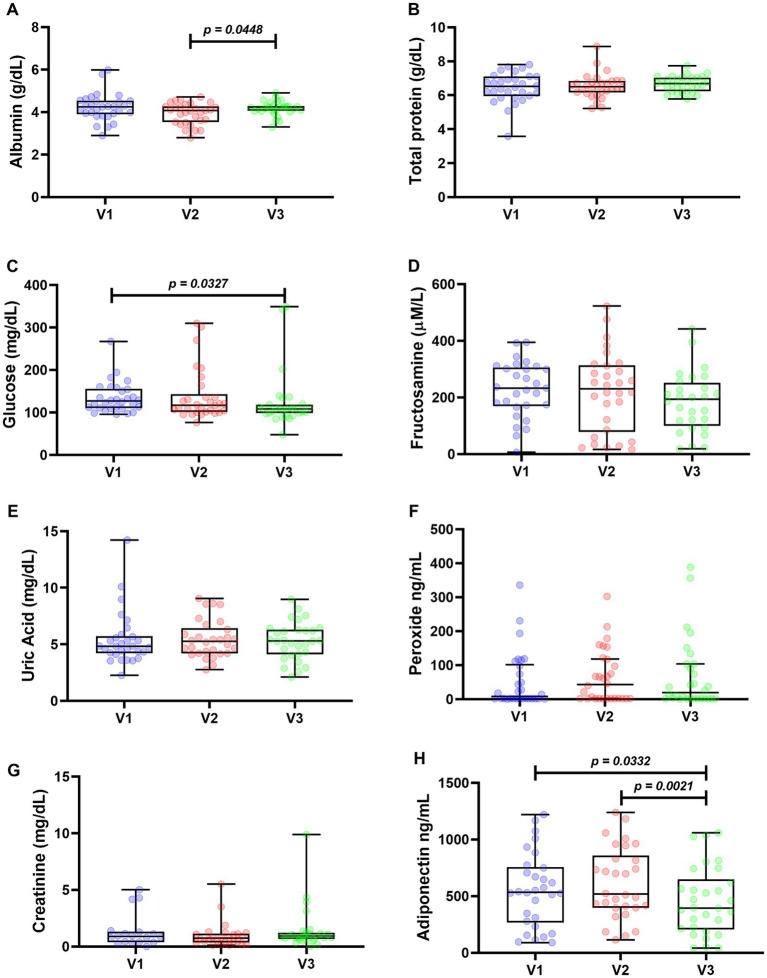
Figure 2.
Metabolic assessments of 30 patients followed up for 120 days. Protein profile: albumin (A) and total proteins (B). Glycemic profile: glucose (C) and fructosamine (D). Uric acid (E), peroxide (F), creatinine (G), and adiponectin (H) Wilcoxon test was used for statistical analysis in (C), (E–G), Anova one way (A,B,H), and paired t test in (D). Values of p < 0.05 were considered significant.

