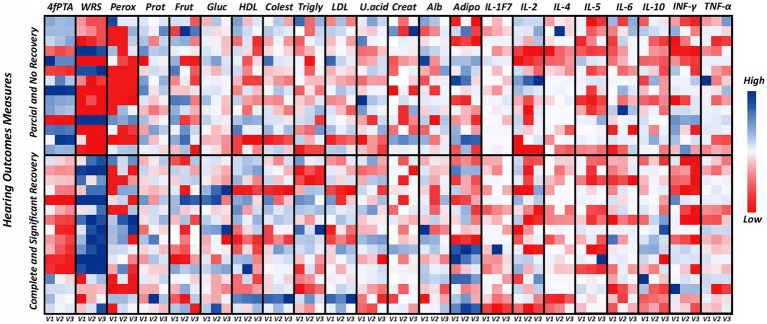
Figure 5.
Heat map of metabolic and inflammatory parameters in patients with sudden sensorineural hearing loss. The values for each patient are shown in the small squares, with the color intensity representing the highest values in blue, the average values in white and the lowest values in red for each analyte tested after 7 days (V1), 30 days (V2) and 120 days (V3). The graph is divided according to hearing recovery, with 14 patients having partial and no recovery and 16 having complete and significant hearing recovery. V1 = 7 days, V2 = 30 days and V3 = 120 days. 4fPTA, four-frequency pure tone average; WRS, word recognition score; Perox, peroxide; Frut, frutosamine; Gluc, glucose; Colest, cholesterol; Trigly, triglycerides; U. acid, uric acid; Creat, creatinine; Alb, albumin; Adipo, adiponectin.

