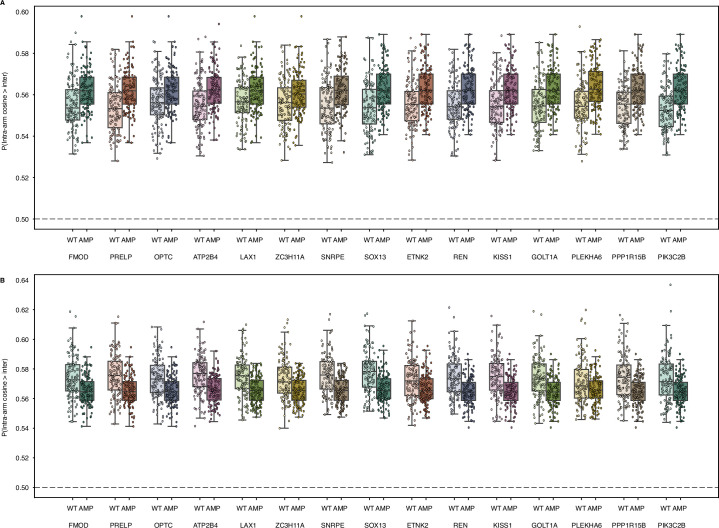
Extended Data Fig. 5. Proximity bias quantification for additional genes between BTG2 and MDM4.
Box and scatter plots of whole-genome level proximity bias quantification by Brunner-Munzel intra-arm vs inter-arm probability from DepMap 22Q4 data with cell lines stratified by gene status. Each point represents a bootstrap sample of cell lines, 128 bootstraps were run for each condition. Box plots show the median, lower and upper quartile with whiskers extending to the furthest points within 1.5 times the inner quartile range. Detailed test statistics in Supplementary Table 3. a, All genes with sufficient data in order of chromosome position between BTG2 and MDM4 on chromosome 1q; wild-type (WT) vs amplification (AMP) in TP53 WT background (FMOD: WT n = 175, AMP n = 87, PRELP: WT n = 174, AMP n = 87, OPTC: WT n = 172, AMP n = 87, ATP2B4: WT n = 167, AMP n = 87, LAX1: WT n = 171, AMP n = 87, ZC3H11A: WT n = 172, AMP n = 87, SNRPE: WT n = 177, AMP n = 86, SOX13: WT n = 169, AMP n = 87, ETNK2: WT n = 170, AMP n = 87, REN: WT n = 173, AMP n = 87, KISS1: WT n = 176, AMP n = 87, GOLT1A: WT n = 173, AMP n = 87, PLEKHA6: WT n = 158, AMP n = 86, PPP1R15B: WT n = 171, AMP n = 87, PIK3C2B: WT n = 158, AMP n = 87). b, Same as a, in TP53 LOF background (FMOD: WT n = 182, AMP n = 81, PRELP: WT n = 183, AMP n = 81, OPTC: WT n = 182, AMP n = 81, ATP2B4: WT n = 180, AMP n = 80, LAX1: WT n = 184, AMP n = 80, ZC3H11A: WT n = 182, AMP n = 80, SNRPE: WT n = 189, AMP n = 80, SOX13: WT n = 180, AMP n = 80, ETNK2: WT n = 186, AMP n = 80, REN: WT n = 186, AMP n = 79, KISS1: WT n = 189, AMP n = 79, GOLT1A: WT n = 185, AMP n = 79, PLEKHA6: WT n = 174, AMP n = 78, PPP1R15B: WT n = 178, AMP n = 79, PIK3C2B: WT n = 172, AMP n = 79). Genes with less than 25 cell lines in a given condition are not shown.

