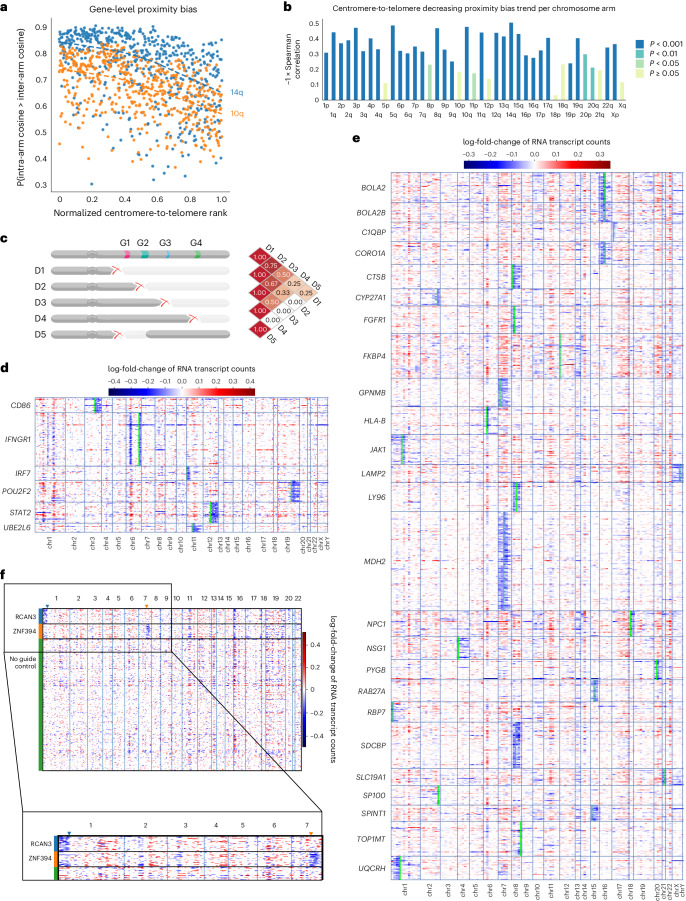
Fig. 2. Genome-wide phenomic measurements and transcriptomic data support a model of chromosomal truncation underlying proximity bias.
a, A scatter plot of gene-level proximity bias showing the one-sided Brunner–Munzel probability of intra-arm cosine values exceeding inter-arm cosine values versus position within the chromosome arm for two arms in rxrx3 data. A negative Spearman correlation supports the visual pattern seen in Fig. 1c of weakening proximity bias signal toward the telomeres. b, Spearman correlations in plots similar to Fig. 2a across all chromosome arms for the rxrx3 data. The height of the bar for each arm agrees well with the degree of fading in diagonal blocks in Fig. 1d. The colors correspond to Bonferroni-corrected P values. c, A schematic representation of how the pattern of weakening signal toward telomeres observed in chromosome-arm heat maps may arise by deletions sharing LOF of multiple key genes. D1, …, D4 represent varying-length truncations and D5 an intra-arm deletion. D1 and D2 both lose three key genes and hence are highly similar, while D1 and D4 share only one and so may look less similar. The intra-arm deletion D5 shares only one key gene loss with D1 and zero losses with D2–D4 and, therefore, is expected to show less proximity bias. d, A heat map of copy number change estimates in Papalexi et al.36 for genes resulting in proximal deletions when targeted by CRISPR–Cas9. Each row in the heat map represents a cell exhibiting deletion near the target gene as in the row label. The rows are ordered alphabetically based on target gene name. Each column represents a gene, ordered by the chromosome position. The lime bars represent the target gene positions. e, A heat map of copy number change estimates in Frangieh et al.37. f, A heat map of copy number change estimates in bulk RNA sequencing samples showing loss of chromosome regions telomeric to the cut site of guides targeting introns in the RCAN3 and ZNF394 loci. Each row in the heat map represents a treatment well. Each column represents a gene, ordered by chromosome position.

