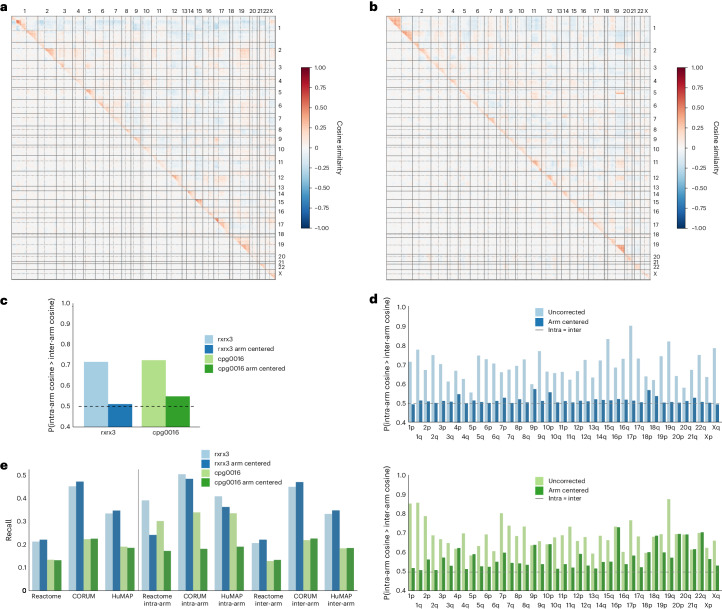
Fig. 5. Geometric correction reduces proximity bias effect.
Split heat maps of pairwise cosine similarities before (above diagonal) and after (below diagonal) chromosome-arm correction. a, The split heat map for rxrx3. b, The split heat map for cpg0016. c, A bar plot of genome-wide proximity bias quantification by Brunner–Munzel test statistic before and after chromosome-arm correction for rxrx3 and cpg0016. The correction greatly reduces the probability of within-arm relationships having a stronger cosine similarity than between-arm relationships. The horizontal dashed line at 0.5 indicates the expected baseline if no proximity bias effect was present. d, A bar plot of chromosome arm-level proximity bias quantification by one-sided Brunner–Munzel probability before and after chromosome-arm correction for rxrx3 (top) and cpg0016 (bottom). The correction reduces the probability of within-arm relationships having a stronger cosine similarity than between-arm relationships for most chromosome arms. Horizontal dashed lines at 0.5 indicate the expected baseline if no proximity bias effect was present. e, Annotated relationship recall benchmarking metrics with and without chromosome-arm correction, both at the global scale (left of vertical line) and stratified by within-arm or between-arm relationships.

