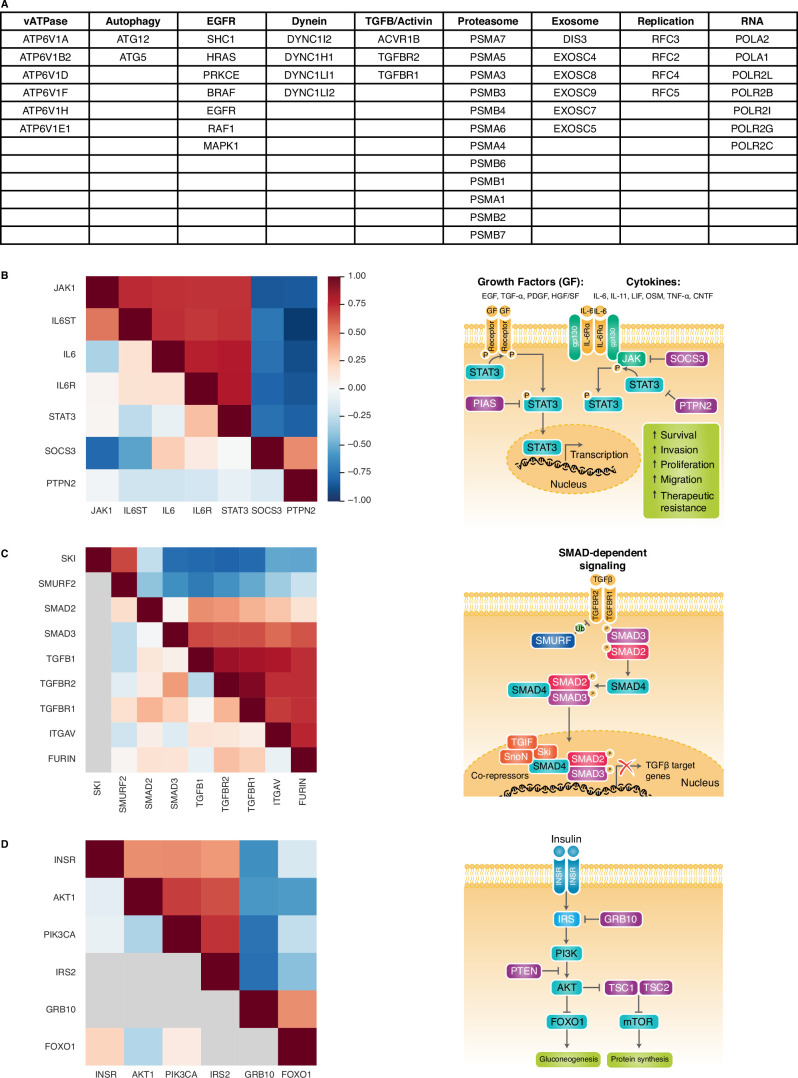
Extended Data Fig. 1. Rxrx3 and cpg0016 example pathways.
a, Table of genes shown in Fig. 1b. b, c, d, Heatmaps of rxrx3 (above diagonal) and cpg0016 (below diagonal) data for selected biological pathways with corresponding pathway diagrams for JAK/STAT, TGF-beta, and insulin biology. Data not present in cpg0016 shown in gray. b, Example interleukin (IL) 6 pathway: IL6, IL6R, IL6ST, JAK1, and STAT3 activate the IL-6 signaling pathway76. CRISPR-Cas9 targeting of these genes leads to similar cellular phenotypes and produces positive cosine similarities (red squares between IL6, IL6R, IL6ST, JAK1, and STAT3 in the heatmap). As inhibitors of the IL-6 pathway, SOCS3 and PTPN2 demonstrate a negative cosine similarity to the pathway components IL6/IL6R/IL6ST/JAK1/STAT3, especially in the rxrx3 HUVEC data (blue squares)76,77. c, Example TGF-beta pathway: FURIN, TGFB1, TGFBR1, TGFBR2, SMAD2, and SMAD3 activate the TGF-beta pathway. CRISPR-Cas9 targeting of these genes gives a similar cellular phenotype and high cosine similarity (red squares in the heatmap)78. SMURF2 and SKI inhibit the TGF-beta pathway, and CRISPR-Cas9 targeting of SMURF2 and SKI, show high cosine similarity to each other but negative cosine values to FURIN, TGFB1, TGFBR1, TGFBR2, SMAD2, and SMAD3 (blue squares)78,79. Grey squares indicate genes not present in the cpg0016 data. d, Example insulin pathway: INSR, IRS2, AKT1, PIK3CA transmit insulin signaling80. CRISPR-Cas9 targeting these factors gives similar phenotypes and therefore they are highly cosine-similar (red squares between INSR/IRS2/AKT1/PIK3CA in the heatmap). GRB10 and FOXO1 inhibit insulin signaling, reflected in negative cosine similarities between CRISPR-Cas9 targeting of GRB10 and INSR, IRS2, AKT1 and PIK3CA (blue squares)80. Grey squares indicate genes not present in the cpg0016 data.

