Figure 7.
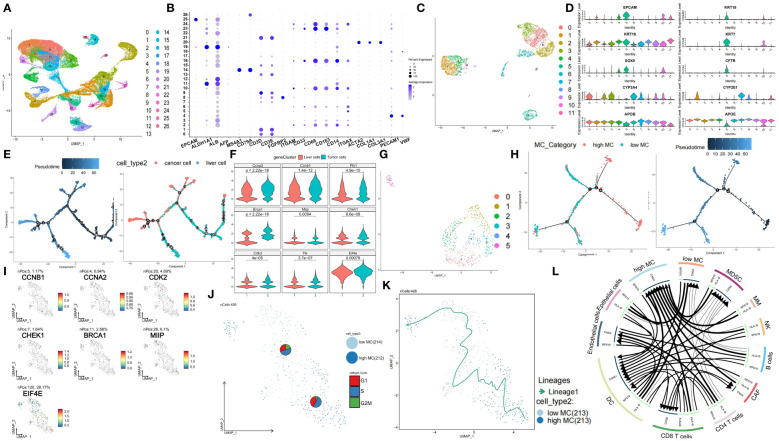
Single-cell characterization of cellular heterogeneity of MCGs in HCC. (A) UMAP clustering of diverse cell types and percentages in GSE202642. (B) Bubble plot of diverse cell types marker expression. (C) UMAP clustering of diverse tumor and liver cell types and percentages. (D) Violin plots of diverse tumor and liver cell types marker expression. (E) Pseudotime trajectory plot of single cells colored by pseudotime order and cell types. (F) Expression comparison of hub and prognostic MCGs between liver and tumor cells. (G) UMAP clustering of diverse tumor cell types and percentages. (H) Pseudotime trajectory plot of single cells colored by pseudotime order and high/low MC cell types. (I) PAGA feature plots of MCGs expression. (J) PAGA plot of single cells with cycle phase proportion, stratified by cell types. (K) Trajectory inference of single cells grouped by high/low MC type. (L) Inter-cell communication network between high/low tumor cells and immune cells.

