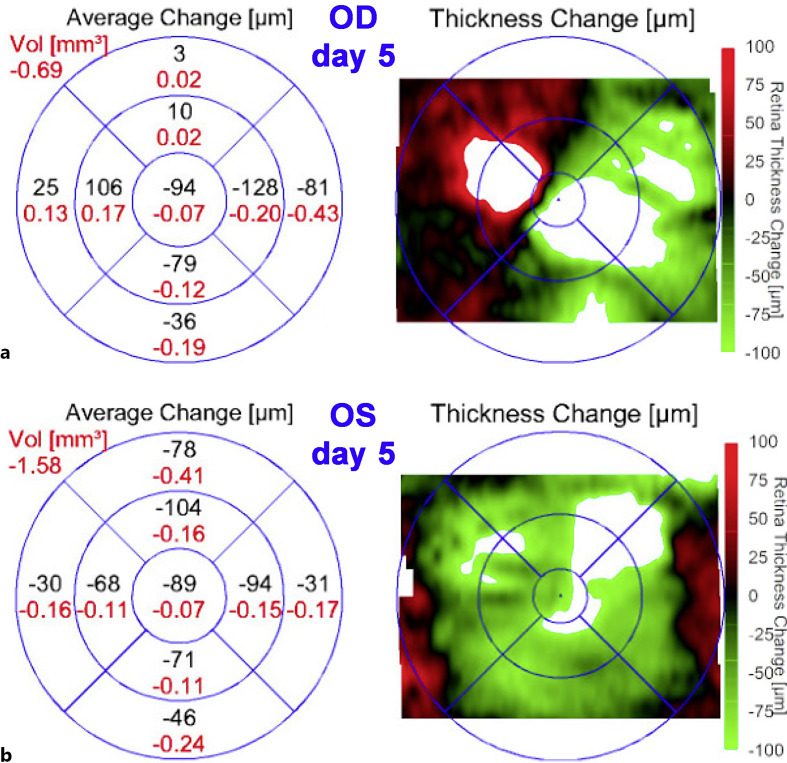
Fig. 2.
OCT changes on day 5 compared to baseline. The left panels are diagrams showing the average change in retinal thickness (μm in black) and volume (mm3 in red) on day 5 compared to baseline for the right eye (a) and left eye (b). The right panels show macular maps of changes in retinal thickness for the right eye (a) and left eye (b). As shown by the color scale to the right, red represents thickening while green represents thinning compared to baseline.

