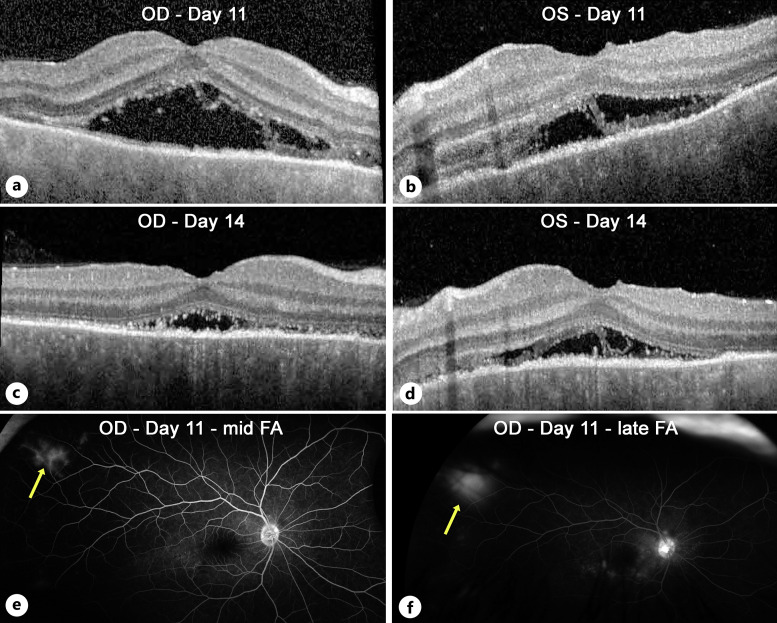
Fig. 3.
OCT and FA changes by 2 weeks after presentation. OCT imaging demonstrated a significant decrease in macular fluid on day 11 (a, b), which became more significant by day 14 (c, d). Fluorescein angiography of the right eye showed a reduction in macular leakage compared to baseline but also highlighted an isolated area of peripheral vascular staining in the right eye that was visible in the mid-phase (e, yellow arrow) and progressively leaked up to the late phase (f, yellow arrow).

