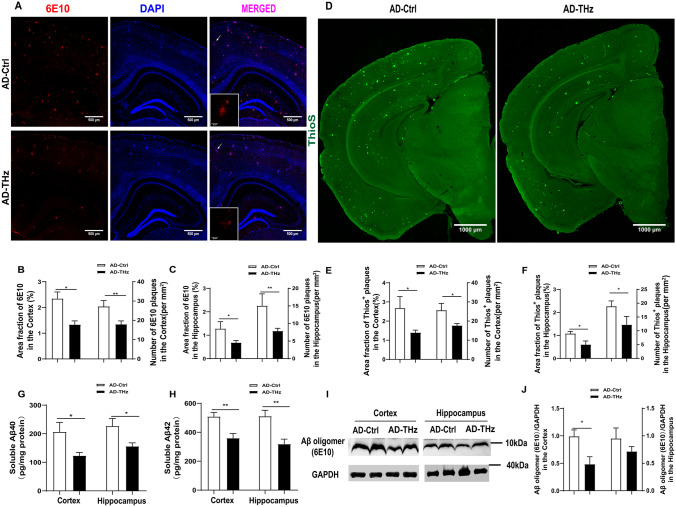
Fig. 2.
THz waves attenuate Aβ pathology in the brain of APPSWE/PS1DE9 mice. Representative images of 6E10 immunofluorescence staining in AD Ctrl and AD-THz groups. Insets: representative morphology at a higher magnification. Scale bars, 500 µm, 50 µm. A–C Comparison of the 6E10 and Aβ plaques in the cortex and hippocampus (Hip). n = 6 per group. D–F Comparison of the Thios+ plaques in the cortex and hippocampus (Hip). Scale bars, 1000 µm, n = 5 per group. G, H Comparison of Aβ40 and Aβ42 levels measured by ELISA in brain homogenates. Aβ levels are normalized by total protein concentration. I, J Protein levels of Aβ oligomer with 6E10 antibodies detected by Western blots (n = 3 per group). Data are presented as the mean ± SEM. **P <0 .01, *P <0.05.

