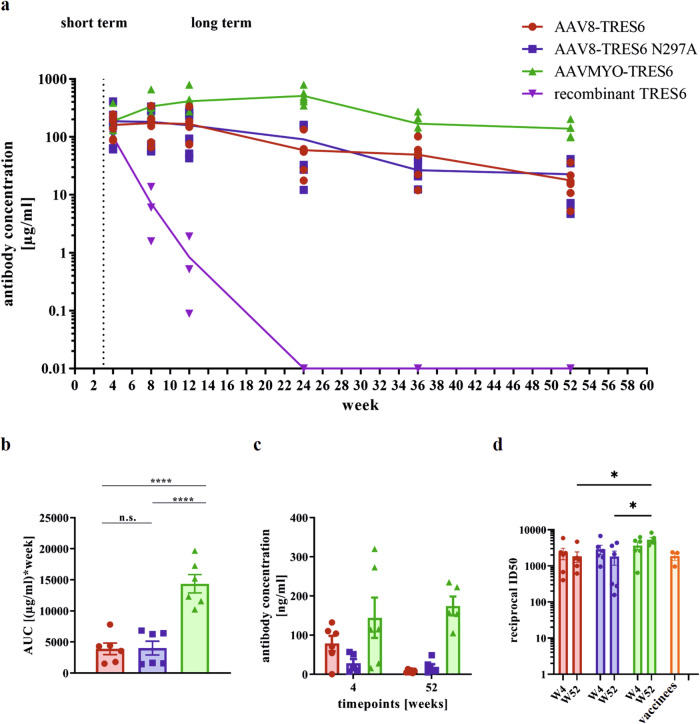
Fig. 5. Long-term kinetic of TRES6 antibodies.
TRIANNI mice received intravenously either 5 × 10¹¹ vg copies of AAV-vector particles (n = 6, ♀ = 3, ♂ = 3) or as control 5 mg/kg body weight TRES6 antibody (n = 3, ♀ = 2, ♂ = 1). a Each data point represents the mean serum antibody concentration in each group at the indicated time point ± SEM. There was no detectable antibody concentration in the control mice measurable from week 24 onwards. b Differences in the total amount of serum antibodies were quantified for vector-transduced mice by calculating the area-under-the-curve (AUC) between weeks 4 and 52 of the long-term kinetic for each animal. c At weeks 4 and 52, mice were sacrificed and the TRES6 concentration was determined in the bronchoalveolar lavage fluid of AAV-transduced mice by ELISA. Each bar shows the mean antibody concentration of the group ± SEM. d Sera from vector-treated mice that were obtained at weeks 4 and 52 were tested for neutralization in a pseudotype neutralization assay and were compared to sera from human vaccinees. The reciprocal of the dilution at which 50% inhibition is reached (reciprocal ID50) is shown per mouse. The bars indicate the group mean value ± SEM. b, d Statistical evaluation of the data were performed by Kruskal–Wallis test (one-way ANOVA) and Dunn’s pairwise multiple comparison procedures as post hoc test (*p ≤ 0.05; ****p ≤ 0.0001; not indicated: p > 0.05).

