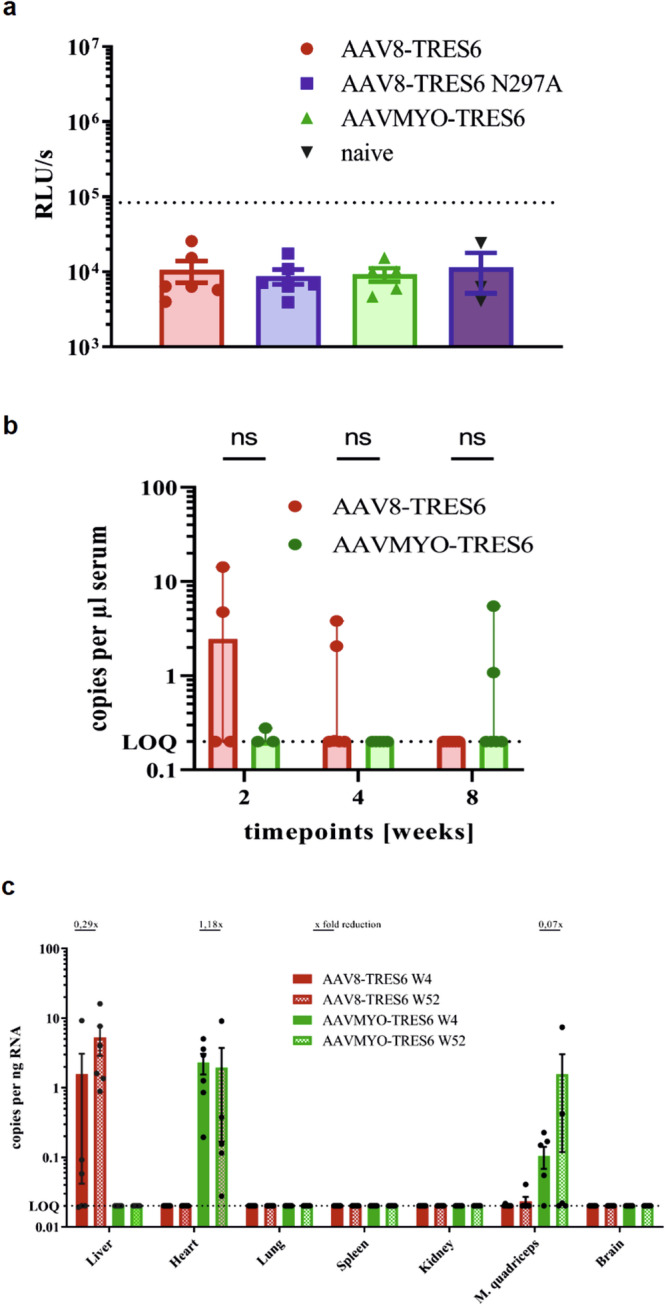
Fig. 6. Anti-drug antibody response, serum AAV vector DNA levels, and RNA expression levels.

a Anti-drug antibody levels in TRIANNI mice 52 weeks after injection of the indicated AAV vector particles. The dotted line represents the assay´s sample cut-off, calculated as the sum of the mean of the values from naïve mice and twice their standard deviation. b Double-stranded DNase-resistant AAV vector DNA copy numbers per μl DNA extracted from murine sera obtained in weeks 2, 4, and 8 of the long-term kinetic experiment with the indicated AAV vector (group size n = 6, ♀ = 3, ♂ = 3). Each bar represents the mean value of each group ± range. For statistical evaluation, a two-way-ANOVA was performed (n.s.: p > 0.05). c AAV vector RNA copy numbers per ng total RNA extracted from the indicated organs at four and 52 weeks after injection of the indicated AAV vector particles (n = 6, ♀ = 3, ♂ = 3). Each bar represents the mean value of each group ± SEM. The fold reduction between the two time points is indicated when the time points are above the lower limit of quantification (LOQ, dotted line).
