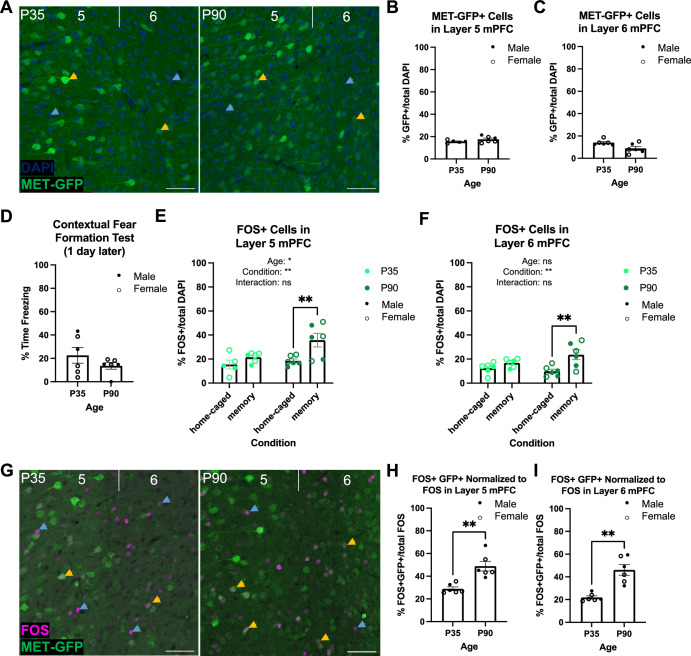
Fig. 5. MET-GFP and FOS expression in infragranular layers 5 and 6 of mPFC at P35 compared to P90.
A Exemplary images of DAPI (blue) and MET-GFP (green) in layers 5 and 6 mPFC at P35 (left) and P90 (right). Blue arrows denote DAPI nuclei, yellow arrows denote GFP+ cells, scale bars = 50 µm. B Quantification of the percentage of MET-GFP+ cells in layer 5 mPFC at P35 (n = 5) and P90 (n = 6). No significant difference between ages was determined. C Quantification of the percentage of MET-GFP+ cells in layer 6 mPFC at P35 (n = 6) and P90 (n = 6). No significant difference between ages was determined. D Quantification of the percentage time freezing of MetGFP Shock mice conditioned on P35 (n = 6) or P90 (n = 6) and tested 1 d later. No significant difference between ages was determined. E Quantification of the percentage of FOS+ cells in layer 5 mPFC in P35 and P90 home-caged and contextual fear memory formation tested mice (P35 home-caged: n = 5; P35 memory: n = 6; P90 home-caged: n = 6; P90 memory: n = 6). There were significant age and condition effects, with a significant difference between P90 home-caged and P90 memory tested mice (*p < 0.05, **p < 0.01, ns, not significant). F Quantification of the percentage of FOS+ cells in layer 6 mPFC in P35 and P90 home-caged and contextual fear memory formation tested mice (P35 home-caged: n = 6; P35 memory: n = 6; P90 home-caged: n = 6; P90 memory: n = 6). There was a significant condition effect, with a significant difference between P90 home-caged and P90 memory tested mice (**p < 0.01, ns, not significant). G Exemplary images of FOS (magenta) and MET-GFP (green) in layers 5 and 6 mPFC at P35 (left) and P90 (right). Blue arrows denote FOS+ cells, yellow arrows denote FOS+;GFP+ colocalized cells, scale bars = 50 µm. H Quantification of the percentage of FOS+;GFP+ colocalized cells out of total FOS-expressing cells in layer 5 mPFC in mice conditioned on P35 (n = 6) or P90 (n = 6) and tested 1 d later and in layer 6 mPFC I. There was a significant difference between ages in both layers (**p < 0.01).

