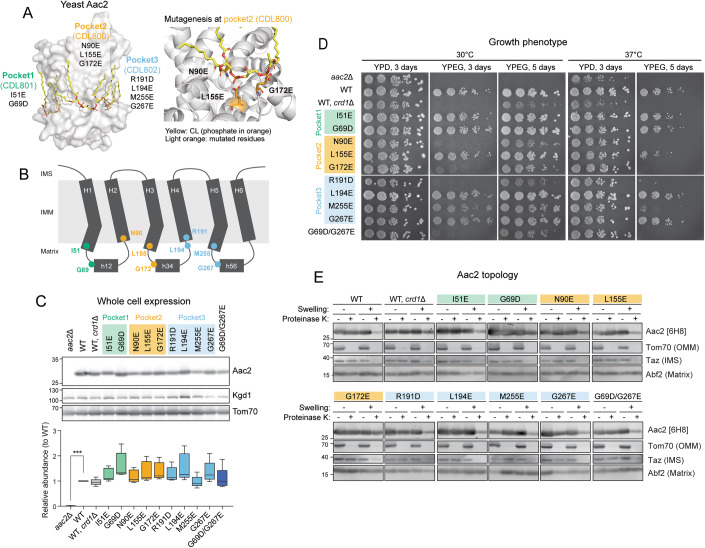
Figure 1. Generation and characterization of yeast Aac2 CL-binding mutants.
(A) Strategy to disrupt CL-binding sites in Aac2. Aac2 was modeled onto bovine ANT1 (PDB ID: 2C3E) using SWISS-MODEL. Negatively charged amino acids introduced (light orange) into Aac2 CL-binding motifs face toward the CL phosphate headgroup (orange). (B) Schematic representation showing the positions of designed mutations in Aac2. (C) Expression of WT and mutant Aac2 was detected in whole cell extracts by immunoblot; Kgd1 and Tom70 served as loading controls (n = 5, biological replicates). Data were shown as box-whisker plots with the box extended from 25th to 75th percentiles and the whiskers indicating the min to max range. Significant difference was obtained by one-way ANOVA with Dunnett’s multiple comparisons test (vs. WT) ***p < 0.001. (D) Growth phenotype of Aac2 CL-binding mutants. Serial dilutions of indicated cells were spotted onto fermentable (YPD) and respiratory (YPEG) media and incubated at 30 or 37 °C for 3–5 days (n = 3, biological replicates). (E) Membrane topology of WT and mutant Aac2. Isolated mitochondria were osmotically ruptured and treated with or without proteinase K as indicated. Aac2 N-terminus was detected by a monoclonal antibody 6H8 recognizing the first 13 amino acids MSSNAQVKTPLPP (n = 6, biological replicates). IMS intermembrane space, IMM inner mitochondrial membrane, OMM outer mitochondrial membrane. In (C–E), representative images from the indicated replicates are shown. Source data are available online for this figure.

