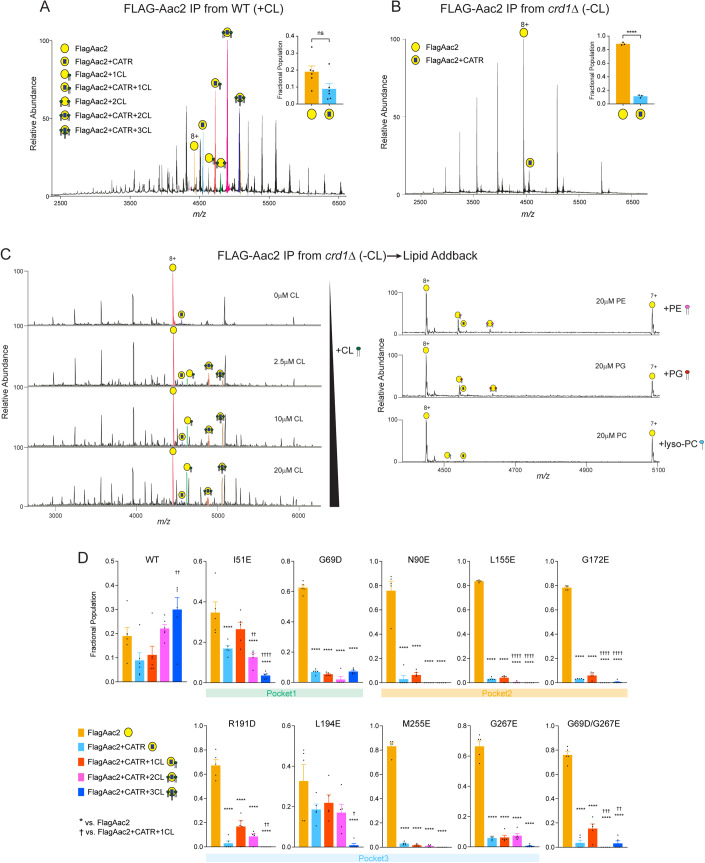
Figure 2. Native mass spectrometry analysis to detect lipid–protein interaction of Aac2.
(A) FlagAac2 affinity purified from WT mitochondria was associated with CATR and up to three CL molecules. (B) FlagAac2 affinity purified from crd1Δ mitochondria which lack CL did not co-purify other phospholipids. Insets in (A) and (B) show the fractional population of FlagAac2 relative to FlagAac2+CATR when immunoprecipitated from WT and crd1Δ mitochondria, respectively. Mean with SEM (n = 3–6: 3 biological replicates with 1–2 technical replicates). Significant differences as determined by Student’s t-test indicated (****p < 0.0001). (C) CL, PE, PG, or lyso-PC was added to FlagAac2 purified from crd1Δ mitochondria at the indicated concentrations. (D) Fractional population of FlagAac2, FlagAac2+CATR alone or associated with one to three CL molecules was determined for WT and Aac2 CL-binding mutants. Mean with SEM (n = 5–6: three biological replicates with 1–2 technical replicates). Significant differences were obtained by one-way ANOVA with Tukey’s multiple comparisons test (* vs. FlagAac2; † vs. FlagAac2+CATR + 1CL); */† p < 0.05, **/†† p < 0.01, ***/††† p < 0.001, ****/†††† p < 0.0001. Source data are available online for this figure.

