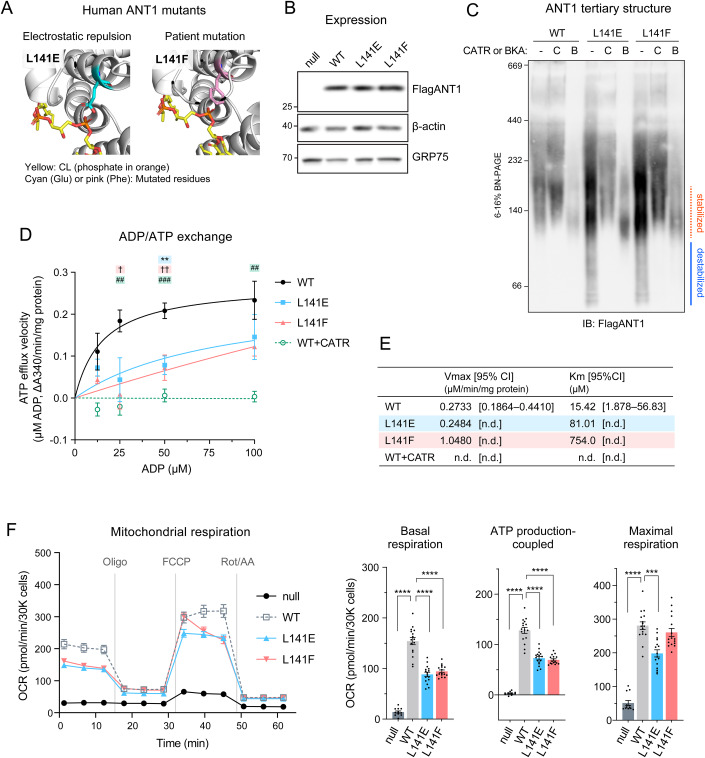
Figure 6. Human ANT1 L141F are structurally and functionally compromised.
(A) Human ANT1 was modeled onto bovine ANT1 (PDB ID: 2C3E) using SWISS-MODEL. (B–F) Flag-ANT1 and the indicated ANT1 mutants were induced by 0.25 μg/ml doxycycline in antnull T-REx-293 cells with three ANT isoforms (ANT1, 2, and 3) knocked out. (B) Expression of ANT1 was detected in whole cell extracts by immunoblot. β-actin and GRP75 were loading controls (n = 3, biological replicates). (C) ANT1 tertiary structure: 80 μg of mitochondria from WT and ANT1 mutants were mock-treated or instead incubated with either 40 μM CATR or 10 μM BKA and then solubilized with 1.5% (w/v) digitonin. The extracts were resolved by 6 to 16% blue native-PAGE and immunoblotted for Flag-ANT1 (n = 3, biological replicates). (D, E) ADP/ATP exchange: The efflux of matrix ATP was detected with isolated mitochondria as NADPH formation (A340; absorbance at 340 nm) as in Fig. 4. The measurement was performed in the presence of 5 mM malate and 5 mM pyruvate. 5 μM CATR was added to WT mitochondria prior to stimulating the efflux (n = 3, biological replicates). (D) The initial velocity following the addition of ADP at indicated concentrations was plotted (mean with SEM). Curve fitting was performed by nonlinear regression. Significant differences obtained by one-way ANOVA with Dunnett’s multiple comparisons test are shown as *, L141E; †, L141F; #, WT + CATR (vs. WT). *p < 0.05, **p < 0.01, ***p < 0.001. (E) Fitted Km and Vmax values from the Michaelis–Menten equation (mean). (F) Cellular oxygen consumption rate (OCR) was measured using a Seahorse XF96e FluxAnalyzer with the Mito Stress Test kit under indicated conditions. Basal and maximal OCR were obtained under glucose stimulation after FCCP treatment to uncouple mitochondria. ATP production-coupled respiration is defined as basal OCR subtracted by post-oligomycin OCR. Significant differences were determined by one-way ANOVA with Tukey’s multiple comparisons test (vs. WT), ***p < 0.001 ****p < 0.0001. Means with SEM (n = 16, 3 biological replicates with 4–8 technical replicates). In (B) and (C), representative images from the indicated replicates are shown. Source data are available online for this figure.

