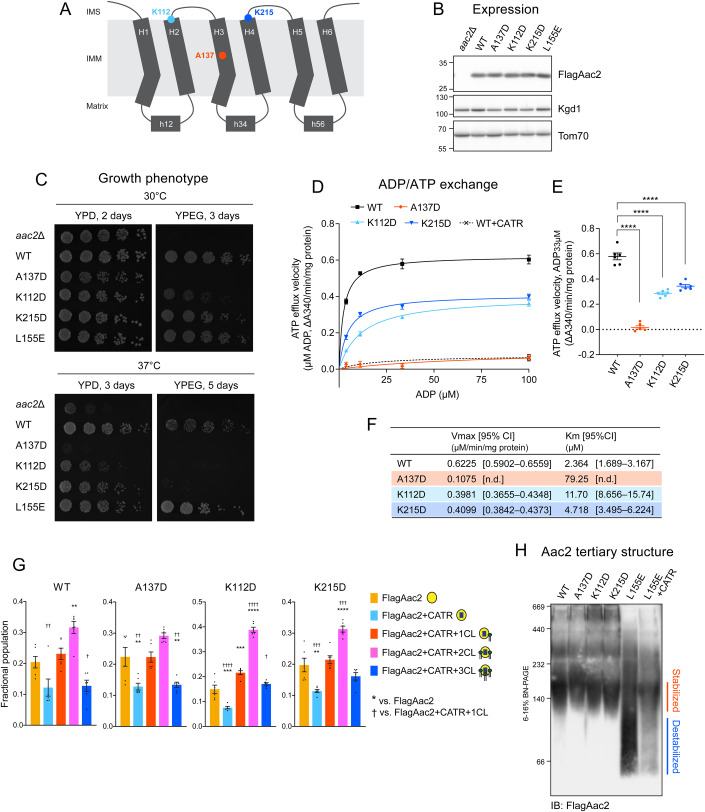
Figure 8. CL binding is preserved in additional transport-defective Aac2 mutants.
(A) Schematic representation showing the positions of non-CL binding related mutations in Aac2. (B) Expression of WT and indicated FlagAac2 mutants. Kgd1 and Tom70 served as loading controls (n = 3, biological replicates). (C) Growth phenotype of Aac2 CL-binding mutants. Serial dilutions of indicated cells were spotted onto fermentable (YPD) and respiratory (YPEG) media and incubated at 30 or 37 °C for 3–5 days (n = 6, biological replicates). (D–F) ADP/ATP exchange: The efflux of matrix ATP was detected as in Fig. 4. The measurement was performed in the presence of 5 mM malate and 5 mM pyruvate (n = 6, biological replicates). (D) The linear part of the initial velocity following the addition of ADP at indicated concentrations was plotted (mean with SEM). Curve fitting was performed by nonlinear regression. (E) The linear part of velocity when 33 μM ADP was added is shown as scatter plots (mean with SEM). (F) Fitted Km and Vmax values were obtained by the Michaelis–Menten equation from the replicated experiments (mean). Significant differences were obtained by one-way ANOVA with Tukey’s multiple comparisons test (vs. WT); ****p < 0.0001. (G) Native MS analysis obtained the fractional population of WT and indicated FlagAac2 mutants associated with CATR and one to three CL molecules. Mean with SEM (n = 6: 2 biological replicates with 3 technical replicates). Significant differences were obtained by one-way ANOVA with Tukey’s multiple comparisons test (* vs. FlagAac2; † vs. FlagAac2+CATR + 1CL); */† p < 0.05, **/†† p < 0.01, ***/††† p < 0.001, ****/†††† p < 0.0001. (H) Aac2 tertiary structure: 100 μg of mitochondria from WT and the indicated mutants were mock-treated or instead incubated with either 40 μM CATR and then solubilized with 1.5% (w/v) digitonin. The extracts were resolved by 6 to 16% blue native-PAGE and immunoblotted for FlagAac2 (n = 4, biological replicates). Source data are available online for this figure.

