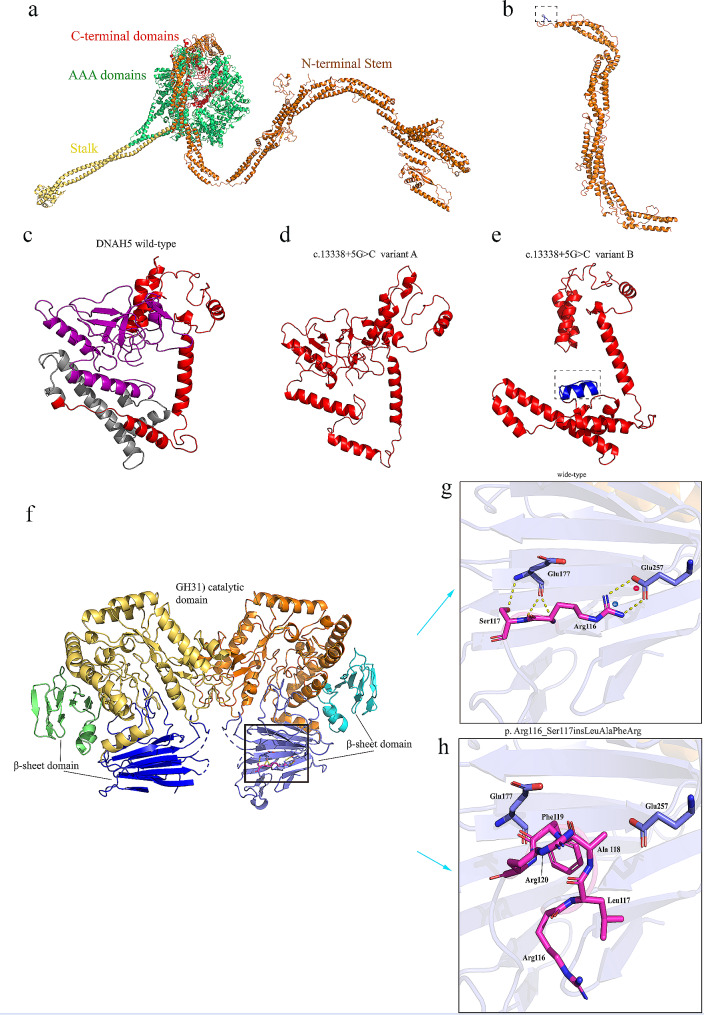
Fig. 5.
Swiss-model (https://swissmodel.expasy.org/), Phyre2 (http://www.sbg.bio.ic.ac.uk/~phyre2/html/page.cgi?id=index) and I-TASSER (https://zhanggroup.org/I-TASSER/) were used to predict the three-dimensional structure of dynamin axonal heavy chain 5 DNAH5 WT, DNAH5 mutants, myogenesis-regulated glycosidase MYORG WT and MYORG mutants and shown in Pymol. (a) Three-dimensional structure map of DNAH5 wild-type. (b) Three-dimensional structure map of DNAH5 c.4314delT (p.Asn1438Lysfs*10). The blue region in the dashed box indicates the additional 10 amino acids caused by frameshift. (c) The c-terminal globular fragment of DNAH5 WT: the gray area shows the deletion of exon 76 in the c.13,338 + 5G > C mutant, resulting in the deletion of 71 amino acids (c. 13,338 + 5G > C mutant A); the purple region indicates translation terminated after 18 amino acids have been translated from the intron where the mutation site is located, resulting in the deletion of 178 amino acids (c.13,338 + 5G > C mutant B). (d) Three-dimensional structure map of c. 13,338 + 5G > C variant A. (e) The dashed box in c. 13,338 + 5G > C mutant B indicates an additional 18 amino acids caused by abnormal splicing. (f-h) Prediction and comparison of the three-dimensional structure of the MYORG wild-type and the variant p.Arg116_Ser117insLeuAlaPheArg: residues 116, 117 and interacting residues are represented as sticks and labeled. Electrostatic interactions and hydrogen bonds are represented by dotted lines; positively and negatively charged residues are marked with a blue (+) and red (-) symbol, respectively

