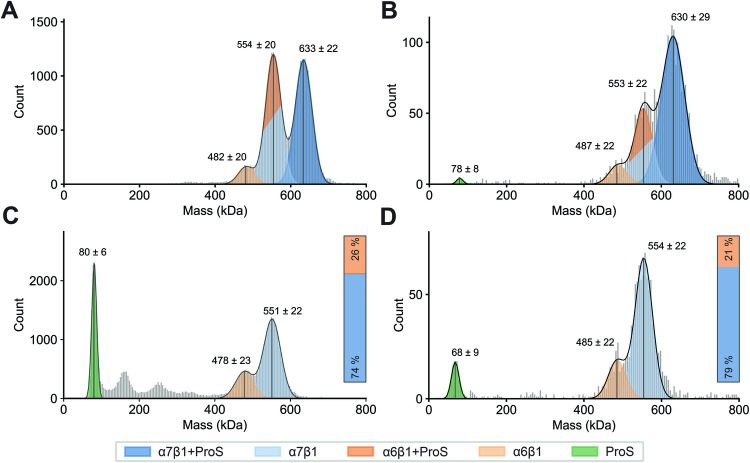
Figure 2. Resolving and quantifying the human serum C4BP variants by charge detection mass spectrometry (CDMS) and mass photometry (MP).
(A) CDMS of native C4BP, (B) MP of native C4BP, (C) CDMS of acidified C4BP, (D) MP of acidified C4BP. Native C4BP (A, B) exhibited two major populations corresponding to α7β1 + ProS (dark blue) and overlapping α6β1+ProS (light blue)/α7β1 (dark orange), as well as a small portion of unbound ProS (green) in MP. The C4BP samples, obtained by acidification (C, D), show ProS dissociation (green), enable isoform differentiation, and highlight dominant C4BP(β+) variants. Bars in (C, D) show isoform abundance of α7β1 (blue) and α6β1 (orange) in the sample, as quantified for denatured CDMS and MP, respectively. Of note, both CDMS and MP were optimized for the detection of the C4BP assembly (~400–800 kDa). Therefore, the quantification of lower MW species, such as monomeric ProS, is more ambiguous. Source data are available online for this figure.

