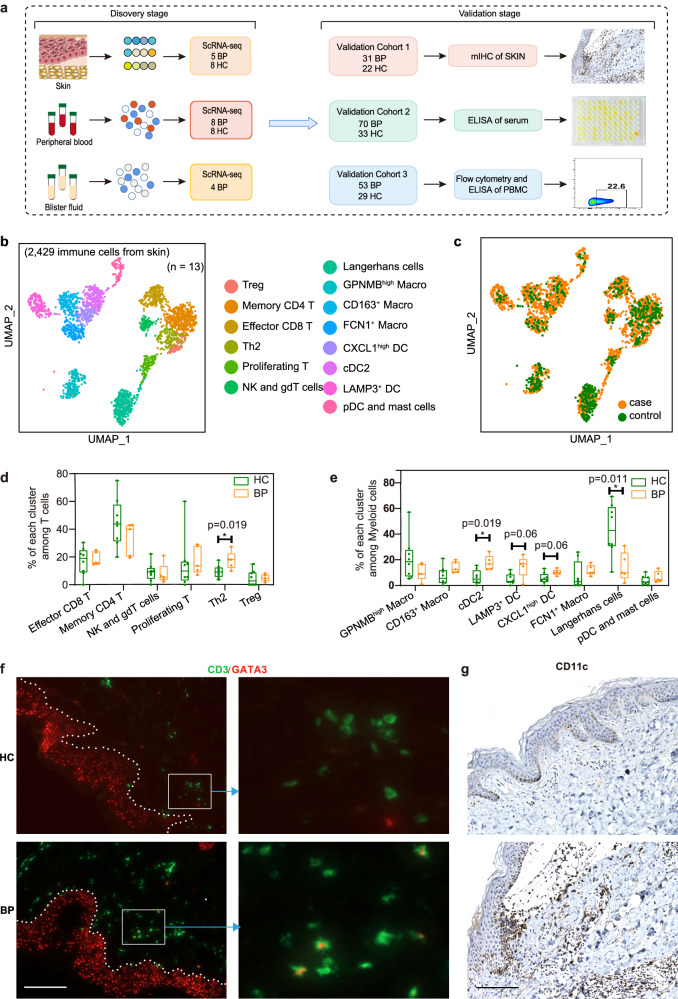
Fig. 1. Sub-clustering of immune cells from the skin scRNA-seq dataset.
a Flowchart depicting the overall experimental design of this study. The number of patients with bullous pemphigoid (BP) and healthy controls (HC) for the discovery cohort and each validation cohort were indicated. b UMAP visualization of the sub-clustering of skin immune cells of the discovery cohort. c UMAP plot for skin immune cells split by BP patients and HC. Cells from patients with BP are shown in orange, whereas cells from HC are shown in green. d Percentage of each T cell subset among all T cells between BP patients (n = 5) and HC (n = 8). e Frequency of each myeloid subset among all myeloid cells between BP patients (n = 5) and HC (n = 8). P-values in d and e were calculated using two-sided Mann–Whitney U-test. Each sample is represented as one dot. *P < 0.05. In the box plot d and e: Minima: Lower limit of the whisker. Maxima: Upper limit of the whisker. Center: Median line inside the box. The upper and lower box bounds represent the 25% and 75% percentile of data. f Immunofluorescence co-staining showing the co-localization of GATA3 and T cell marker CD3 in BP lesions. scale bar = 150 μm. g Immunochemistry staining showing the CD11c-expressed DC cells within the lesions of BP patients. scale bar = 150 μm. Data are from three independent experiments in f and g. DC, Dendritic Cells.

