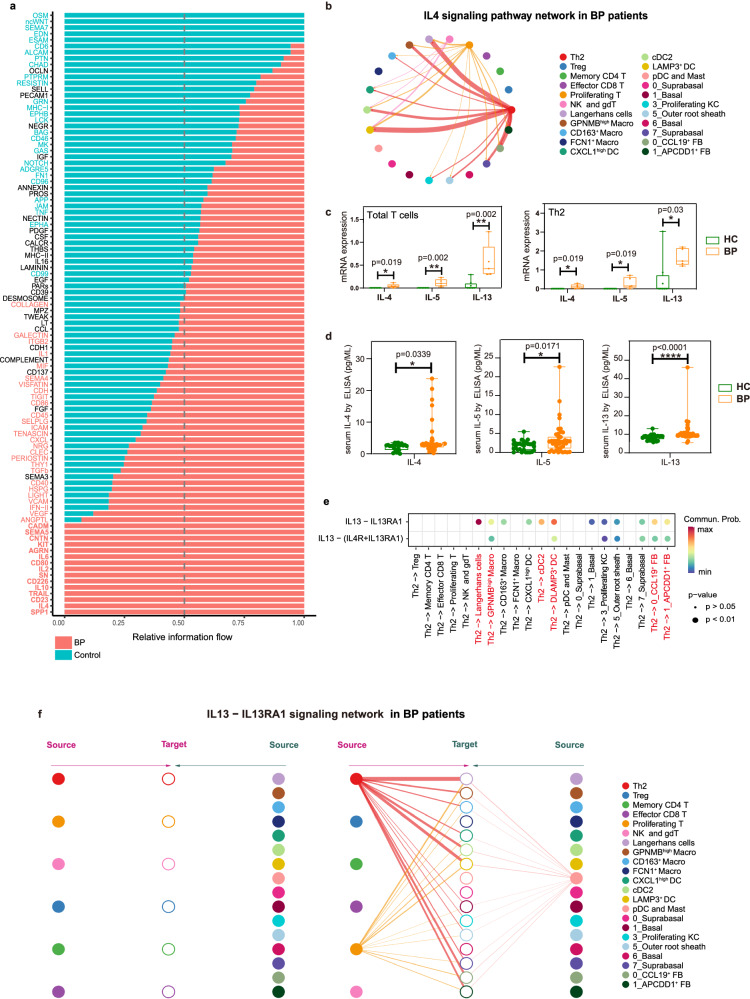
Fig. 3. The IL13-IL13RA1 mediates the interaction between Th2 and fibroblasts/myeloid cells.
a Significant signaling pathways were ranked based on differences in the overall information flow within the inferred networks between BP and HC skin scRNA-seq dataset. We have added the abbreviations in Supplementary data 15. b Circle plot of the inferred IL4 signaling pathway among major cell types in the BP group. c Bar charts showing IL4, IL5 and IL13 mRNA expression within total T cells (left) and Th2 subpopulation (right) between BP (n = 5) and HC (n = 8). d Protein levels of IL-4, IL-5 and IL-13 in serum from BP (n = 43) and HC (n = 29) examined by ELISA. In the box plot c and d: Minima: Lower limit of the whisker. Maxima: Upper limit of the whisker. Center: Median line inside the box. The upper and lower box bounds represent the 25% and 75% percentile of data. Each sample is represented as one dot. e Comparison of the multiple ligand–receptor pairs among IL4 signaling pathway originated from Th2 cells. P-values were computed from one-sided permutation test (CellChat 1.5.0). f Hierarchical plot showing inferred intercellular communication network of IL13-IL13RA1 signaling in BP skin. Left and right portions show autocrine and paracrine signaling, respectively. In the left part: The six T cell clusters in the middle acted as the signal-receiving cells. The left half of the diagram depicts autocrine signal, which refers to IL13 signal released by the six T cell clusters that act on themselves. Correspondingly, the right half shows paracrine signal, which IL13 signal released by other types of cells that act on the six T cell clusters. In the right part: The non-T cell clusters acted as the signal-receiving cells. The left half of the diagram depicts paracrine signal, which IL13 released by six T cell clusters that act on these non-T cell clusters. While, the right half shows autocrine signals, which are signals released by these non-T cell clusters that act on themselves. P-values in c and d were calculated using two-sided Mann–Whitney U-test. *P < 0.05, **P < 0.01, ****P < 0.0001.

