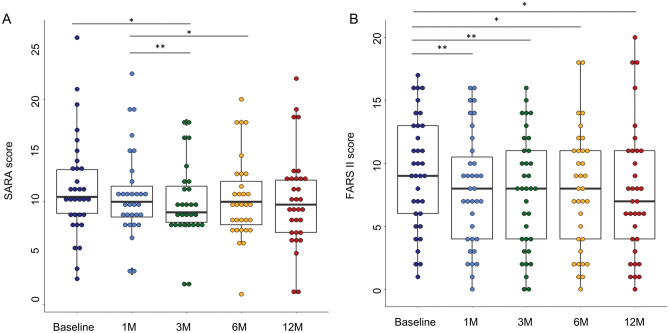
Figure 2.
Box and whisker plots for the 1-year changes in the measurements of the clinical severity of ataxia 1-year changes in the SARA (A) and FARS II (B). SARA: Scale for the Assessment and Rating of Ataxia, and FARS: Friedreich Ataxia Rating Scale. The upper and lower margins of the rectangle represent the first and third quartiles, respectively. The horizontal line within the box represents the median value. The upper and lower vertical lines represent ranges or distances of 1.5 times the interquartile range from the first or third quartile values, respectively. *P < 0.05.

