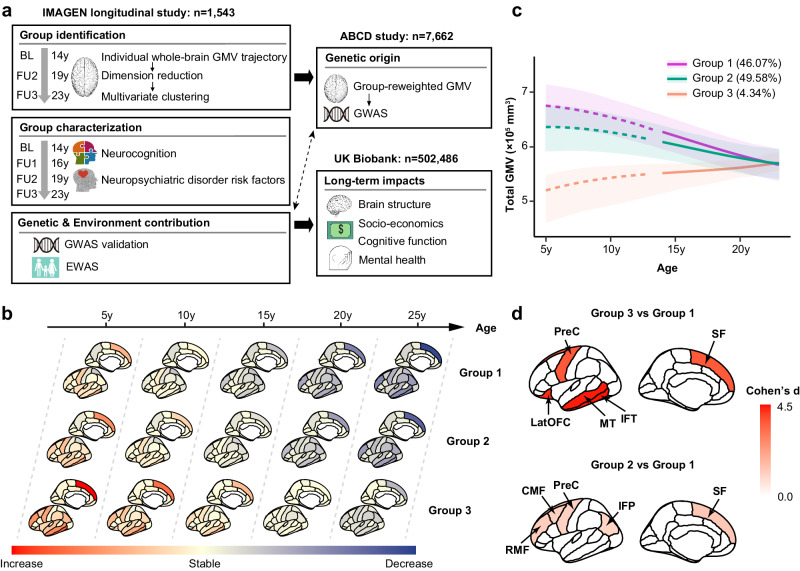
Fig. 1. Whole-brain gray matter volume (GMV) developmental patterns define three neurodevelopmental groups.
a Schematic workflow of the analytic methodologies. GMV trajectory in 44 ROIs spanning the whole brain was estimated for adolescents in the IMAGEN study (n = 1543). Multivariate clustering was conducted to identify groups with distinct neurodevelopmental patterns, followed by group characterization. Genome-wide association study (GWAS) was conducted in the ABCD study (n = 7662) using the proxy phenotype, and epigenome-wide association study (EWAS) was conducted in IMAGEN (n = 909). Last, long-term impacts of the polygenic risk for delayed neurodevelopment were investigated among participants in UK Biobank (n = 502,486). BL, baseline; FU, follow-up. b Whole-brain GMV growth rates (ranging from increase, stable to decrease) at age 5 y, 10 y, 15 y, 20 y and 25 y were estimated for each group, adjusting for sex, imaging site, handedness, and intracranial volume. Group 3 showed delayed GMV development compared to Group 1 and 2. c Total GMV developmental trajectories (with 95% confidence bands; the center of the band represents the estimated mean total GMV trajectories within each group) for the three groups (purple for Group 1; green for Group 2; orange for Group 3). These trajectories were estimated adjusting for sex, imaging site, handedness, and intracranial volume. Group 1 and 2 exhibited similar GMV developmental trend, while Group 3 had opposite GMV developmental trend. d Top 5 discriminating ROIs with largest t values comparing the GMV trajectories between Group 3 (n = 67) and Group 1 (n = 711) (top), and between Group 2 (n = 765) and Group 1 (n = 711) (bottom), adjusting for sex, imaging site, handedness and intra-cranial volume. Two sample two-tailed t-test: Group 3 vs Group1, IFT (d = 4.43, t = 20.13, Padj < 0.001), MT (d = 4.38, t = 20.07, Padj < 0.001), LatOFC (d = 4.26, t = 18.31, Padj < 0.001), PreC (d = 3.63, t = 18.11, Padj < 0.001), SF (d = 3.61, t = 17.92, Padj < 0.001); Group 2 vs Group 1, SF (d = 1.28, t = 24.50, Padj < 0.001), RMF (d = 1.14, t = 21.95, Padj < 0.001), CMF (d = 1.09, t = 20.77,Padj < 0.001), PreC (d = 1.05, t = 20.14, Padj < 0.001), IFP (d = 1.00, t = 19.07, Padj < 0.001). LatOFC lateral orbitofrontal cortex, RMF rostral middle frontal, CMF caudal middle frontal, SF superior frontal, PreC precentral, MT middle temporal, IFT inferior temporal, IFP inferior parietal. Relevant source data were provided in the Source Data file.

