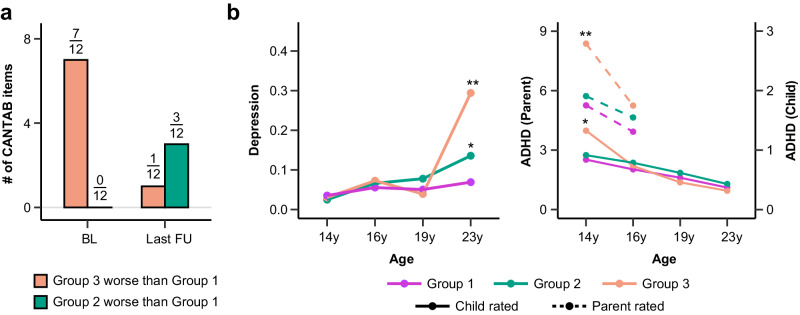
Fig. 2. Structural neurodevelopment predicts neurocognition and risk factors for neuropsychiatric disorders.
a Comparison of neurocognitive performances between Group 3 and Group 1 (orange), and between Group 2 and Group 1 (green) at baseline (BL) and the last follow-up (FU). Total number of neurocognitive tests in CANTAB where Group 3 performed worse than Group 1 decreased from 7/12 at BL to 1/12 at the last FU, while the number of tests where Group 2 performed worse than Group 1 increased from 0 to 3/12. Full results with item-specific comparisons among these groups are provided in Supplementary Fig. 7. CANTAB, Cambridge Neuropsychological Test Automated Battery. b Longitudinal trajectories of Depression (Left) and ADHD symptoms (Right) among adolescents in three groups (purple for Group 1; green for Group 2; orange for Group 3). Group-specific means at each visit were plotted and * indicated significant differences relative to Group 1 adjusting for sex, handedness, stie and ICV. Baseline mental health score was also adjusted for comparison at the last follow-up. Two-tailed t-tests were conducted at baseline (14 y) and the last follow-up. BH-FDR method was used for multiple correction. Depression, Group 2 vs Group 1 at 14 y (d = −0.05, Padj = 0.256), Group 2 vs Group 1 at 23 y (d = 0.13, *Padj = 0.023), Group 3 vs Group 1 at 14 y (d = −0.01, Padj = 0.566), Group 3 vs Group 1 at 23 y (d = 0.70, **Padj = 0.001); Parent rated ADHD (dashed line), Group 2 vs Group 1 at 14 y (d = 0.04, Padj = 0.220), Group 2 vs Group 1 at 16 y (d = −0.03, Padj = 0.574), Group 3 vs Group 1 at 14 y (d = 0.34, **Padj = 0.004), Group 3 vs Group 1 at 16 y (d = 0.01, Padj = 0.954); Child rated ADHD (solid line), Group 2 vs Group 1 at 14 y (d = −0.03, Padj = 0.321), Group 2 vs Group 1 at 23 y (d = 0.02, Padj = 0.758), Group 3 vs Group 1 at 14 y (d = 0.34, Padj = *0.042), Group 3 vs Group 1 at 23 y (d = −0.10, Padj = 0.579). ADHD, attention-deficit/hyperactivity disorder. Relevant source data were provided in the Source Data file.

