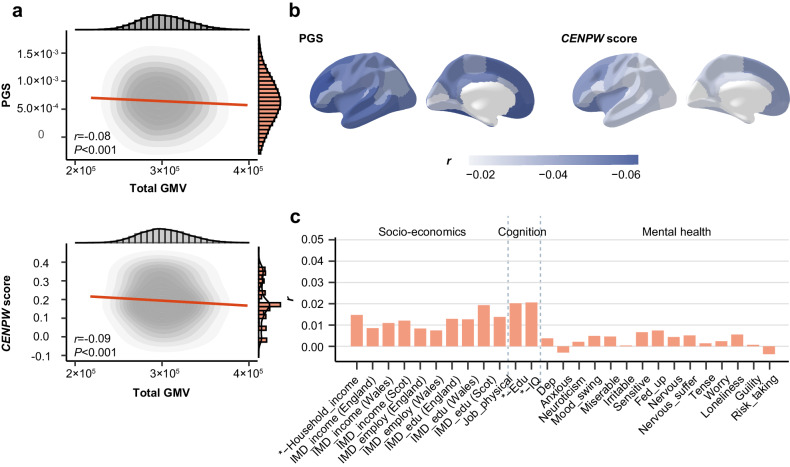
Fig. 5. Genetically-predicted neurodevelopment had limited impact on socio-economic, cognitive and mental health outcomes in mid-to-late adulthood.
a Correlation between polygenic score (PGS) and CENPW score of delayed neurodevelopment and total gray matter volume (GMV) for participants in UK Biobank (n = 337,199). Marginal distributions of PGS and total GMV were both normal. PGS and CENPW score both showed negative correlation with total GMV (r = −0.08, P < 2.2 × 10⁻¹⁶ for PGS and r = −0.09, P < 2.2 × 10⁻¹⁶ for CENPW score). One sample t-test was used. PGS were averaged over different P value thresholds. b Correlation between averaged PGS of delayed neurodevelopment and CENPW score and regional GMV for participants in UK Biobank. Rostral middle frontal (r = −0.07, Padj < 0.001), fusiform (r = −0.07, Padj < 0.001), lateral orbitofrontal (r = −0.07, Padj < 0.001), medial orbitofrontal (r = −0.06, Padj < 0.001) and rostral anterior cingulate (r = −0.06, Padj < 0.001) were among the ROIs with the strongest correlation with PGS, while lateral orbitofrontal (r = −0.06, Padj < 0.001), caudal middle frontal (r = −0.05, Padj < 0.001), rostral middle frontal (r = −0.05, Padj < 0.001), insula (r = −0.05, Padj < 0.001) and superior frontal (r = −0.05, Padj < 0.001) were ROIs having the strongest correlation with CENPW score. These were consistent with the results that participants with higher PGS of delayed neurodevelopment also had worse performance in spatial working memory in UK Biobank. One sample t test was used with FDR for multiple correction. c Inferiority test of the correlation between averaged PGS and socio-economic, cognitive and mental health outcomes indicated that polygenic risk of delayed neurodevelopment had limited effect on the long-term socio-economic, cognitive and mental health outcomes. Full results were displayed in Supplementary Fig. 15. Similar results were observed between CENPW score and these long-term outcomes (Supplementary Fig. 16). IMD, Indices of Multiple Deprivation; Scot, Scotland; Edu, the highest educational attainment; IQ, intelligence. Relevant source data were provided in the Source Data file.

