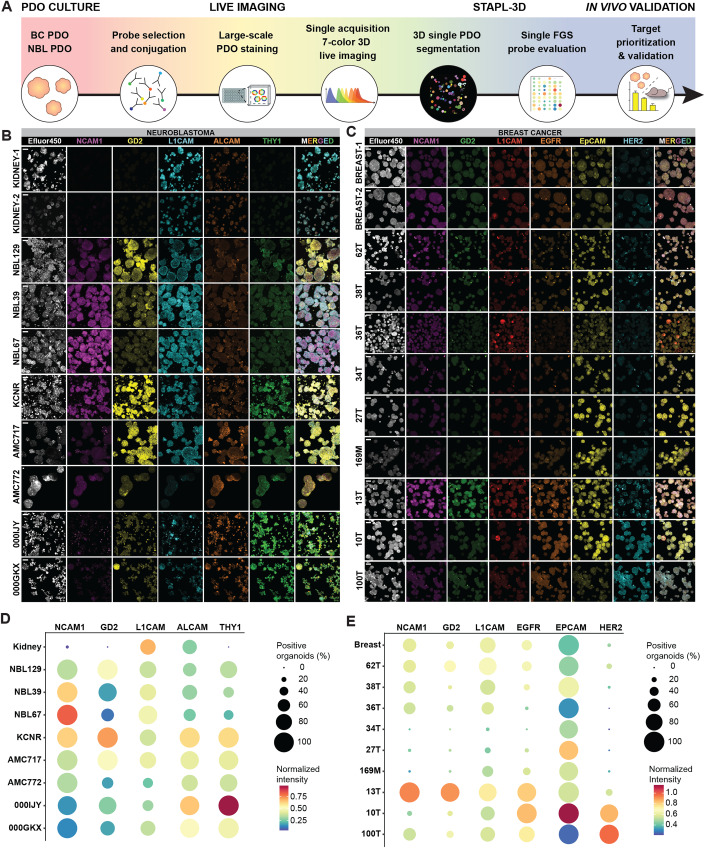
Figure 1. Organoid-based multispectral 3D imaging platform to screen FGS probes.
(A) Schematic representation of the screening platform, including 7-color 3D imaging and STAPL-3D single organoid segmentation and quantification for target prioritization. (B, C) Representative single channel and merged 3D multispectral images of the segmented data, showing heterogeneous expression of selected FGS probes between PDO lines. Scale bars 50 μm. (D, E) Quantification of percentage positively stained organoids (dot size) and normalized fluorescent intensity (blue-to-red color gradient) for the two PDO biobanks and healthy tissue control organoids. (B–E) n = 3 (NB) and n = 4 (BC) independent experiments. Source data are available online for this figure.

