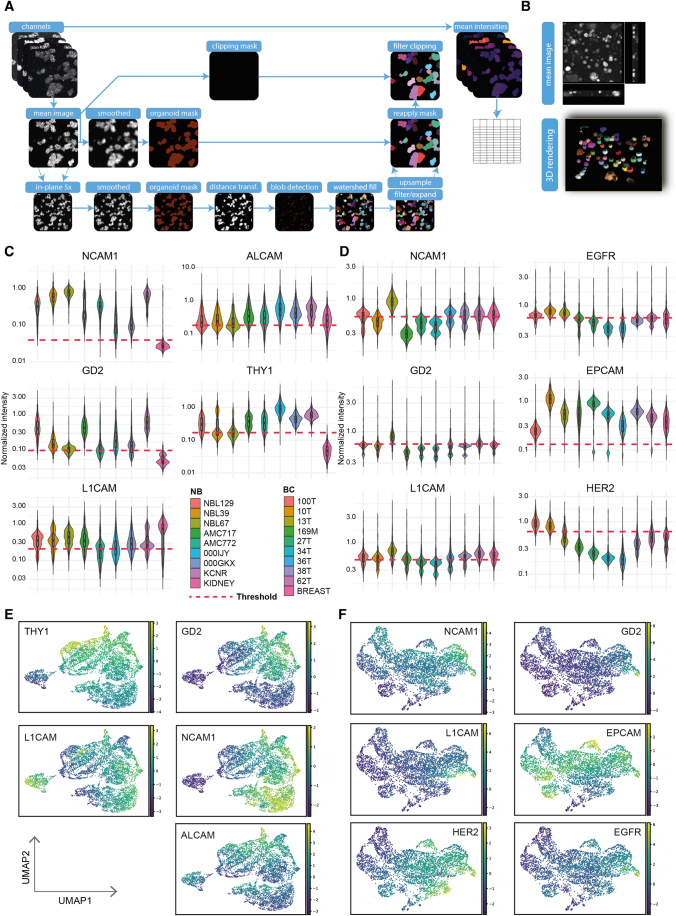
Figure EV3. STAPL-3D pipeline optimized for individual organoid segmentation and fluorescent intensity extraction.
(A) Schematic representation of the STAPL-3D pipeline with key optimization steps for single organoid segmentation. (B) Representative raw 3D imaging data and associated 3D rendered single organoid segmentation. (C, D) Violin plots of the mean fluorescent intensities (MFI) of the screened probes for all individual organoids from the NB (C) and BC (D) PDO biobanks normalized for the experimental day and probe. Dashed line indicates the cut-off used for considering an organoid as positively stained. Boxplots inside violin plots; centre: median, bounds: Q1–Q3, whiskers extend to minimum/maximum limited to 1.5 times the IQR. n = 3 independent experiments. (E, F) Representation of the spatial target distribution used for UMAP clustering of both the NB (E) and BC (F) PDO biobank. n = 3 independent experiments.

