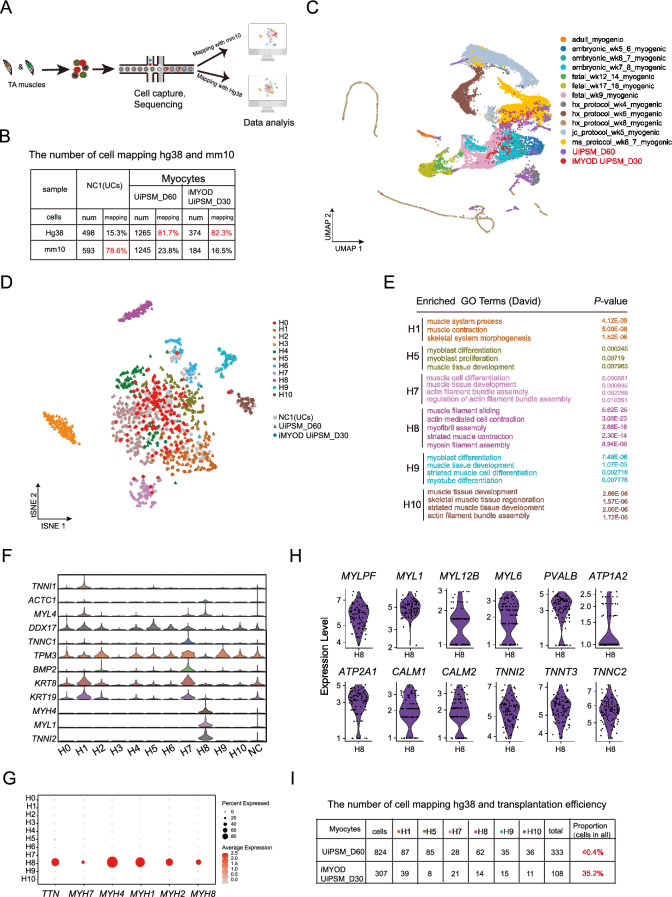
Fig. 4.
scRNA-seq analysis of the cell components of the human skeletal myocytes derived grafts. A Schematic overview of the process involving transplantation of UiPSM and iMYOD UiPSM-derived human myocytes and urine cells into injured mouse TA muscles. One month after transplantation, TA muscles were dissociated into single cells for RNA sequencing. Sequencing data were then mapped to the human (hg38) and mouse (mm10) genomes, respectively. B Quantification of cell numbers and mapping rates from the sequencing data. C UMAP representation of scRNA data from Xi et al.(2020) and our studies, including eight sources of myogenic. D t-SNE plot showed the projection of 2137 cells mapping to human genome (hg38). These cells could be divided in 11 color-coded clusters. The circles, triangles and diamonds represent the control group (urine cells), and UiPSM and iMYOD UiPSM derived human myocytes, respectively. E Gene ontology (GO) analysis revealed gene expression profiles of the groups (H1, h5, h7, h8, h9, h10) that are highly associated with skeletal muscle development in the above 11 clusters. p value < 0.05. F Violin plot showing the expression and ratio of typical mature skeletal muscle cells related genes in each cluster. G Dot plot of expression levels for titin (TTN) and different Myh genes. Color indicates expression level in each cluster; Dot size percent of cells expressing selected genes in each cluster. H Violin plot of expression levels for calcium-handling gene PVALB, Calcium-Transporting ATPase Sarcoplasmic Reticulum (ATP1A2, ATP2A1), Calmodulin (CALM1, CALM2) and troponin (TTN, TNNI2, TNNT3, TNNC2). I Calculating the percentage of cells in skeletal myocytes related clusters (H1, h5, h7, h8, h9, h10) on all sequenced cells of the grafts from UiPSM and iMYOD UiPSM derived human myocytes, when mapping with human genome (hg38)

