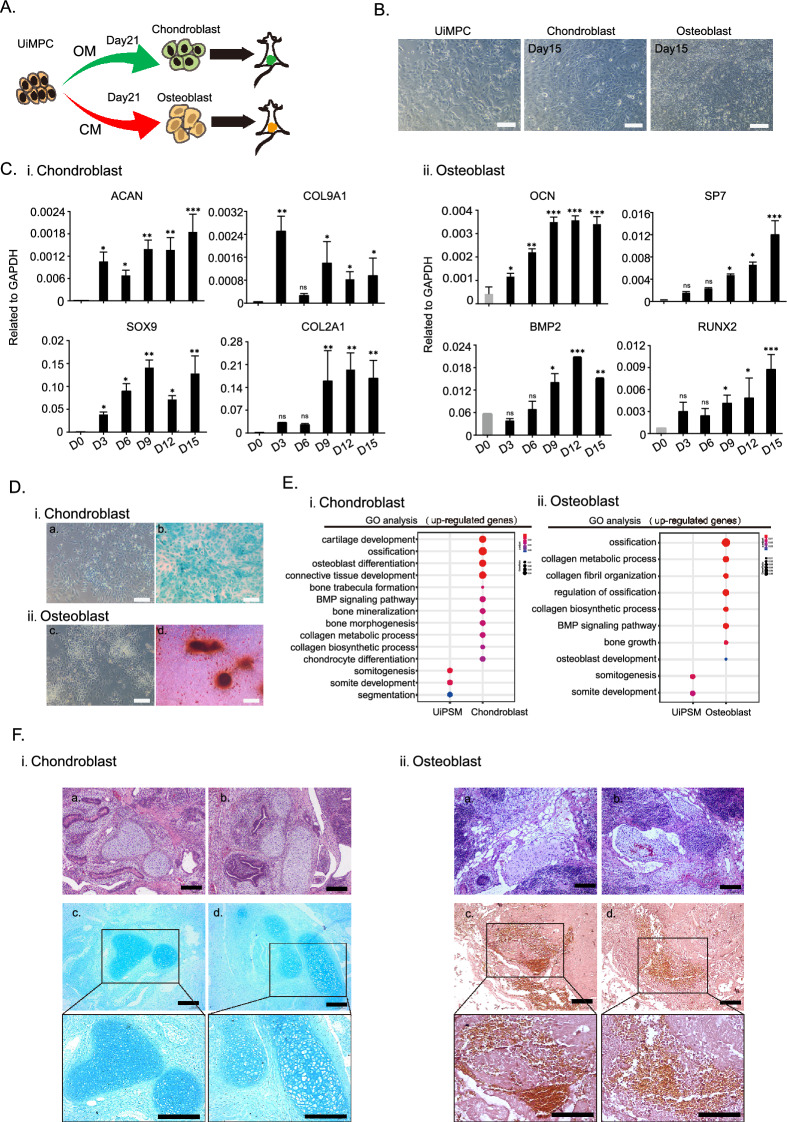
Fig. 5.
UiPSM cells derived axial osteogenesis. A Schematic overview of chondroblasts and osteoblasts differentiated from UiPSM. B Representative images show the chondroblasts and osteoblasts differentiated from UiPSM cells at day 15. Scale bars, 100 µm. n = 3 independent experiments. C i. Representative gene expression of chondroblast (ACAN, COL9A1, SOX9, COL2A1) during the differentiation process. ii. Representative gene expression of osteoblast (OCN, SP7, BMP2, RUNX2) during the differentiation process. (Data are mean ± SD, n = 3 independent experiments). D i. Representative images show the Alcian blue staining of UiPSM cells and chondroblasts at day 15. a, UiPSM cells as a negative control, could not be dyed; b. UiPSM cells induced Chondroblast could be dyed blue in Alcian blue staining. Scale bars, 100 µm. ii. Representative images show the alizarin red staining of UiPSM cells and osteoblasts at day 15. c, UiPSM cells as a negative control, could not be dyed; d. UiPSM cells induced Osteoblast could be dyed red in alizarin red staining. Scale bars, 100 µm. E i. Representative gene ontology enrichment terms associated with chondroblast differentiation in UiPSM and chondroblast cells at day 15. ii. Representative gene ontology enrichment terms related to osteoblast differentiation in UiPSM and osteoblast cells based on up-regulated genes in each sample. F a, b H&E staining revealing the morphological features of grafts derived from UiPSM chondroblasts and osteoblasts transplanted into MITRG mice after 1 month. c, d These sections were further characterized by Alcian Blue and Alizarin Red staining, respectively. Scale bars, 100 µm

