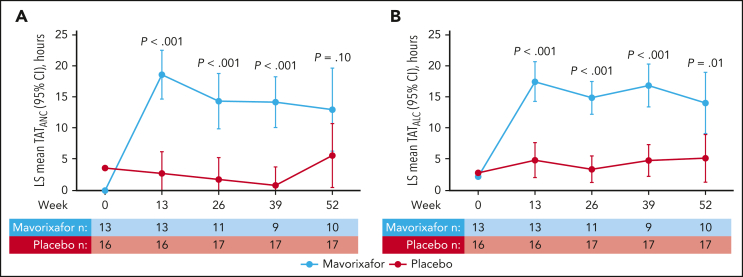
Figure 1.
LS mean TATANC and TATALC. TATANC (A) and TATALC (B) vs time on treatment with mavorixafor vs placebo over 52 weeks (intent-to-treat [ITT] population). TATANC LS mean (95% CI) for mavorixafor vs placebo at weeks 13, 26, 39, and 52 were 18.6 hours (14.5-22.7) vs 2.8 (0-6.4), P < .001; 14.4 (9.7-19.0) vs 1.8 (0.0-5.5), P < .001; 14.2 (9.9-18.5) vs 0.8 (0.0-4.0), P < .001; and 13.0 (6.0-20.0) vs 5.6 (0.2-11.1), P = .10, respectively. TATALC LS mean (95% CI) for mavorixafor vs placebo at weeks 13, 26, 39, and 52 were 17.5 (14.1-20.8) vs 4.9 (1.9-7.8), P < .001; 14.9 (12.1-17.6) vs 3.4 (1.2-5.7), P < .001; 16.8 (13.2-20.4) vs 4.8 (2.1-7.5), P < .001; and 14.0 (8.9-19.2) vs 5.1 (1.1-9.2), P = .01, respectively. At week 52, 3 of 17 participants receiving placebo were given mavorixafor in advance of their week 52 assessments. One participant receiving mavorixafor did not take mavorixafor at week 52. Some samples collected were not measurable; 3 participants in the mavorixafor group discontinued mavorixafor treatment.

