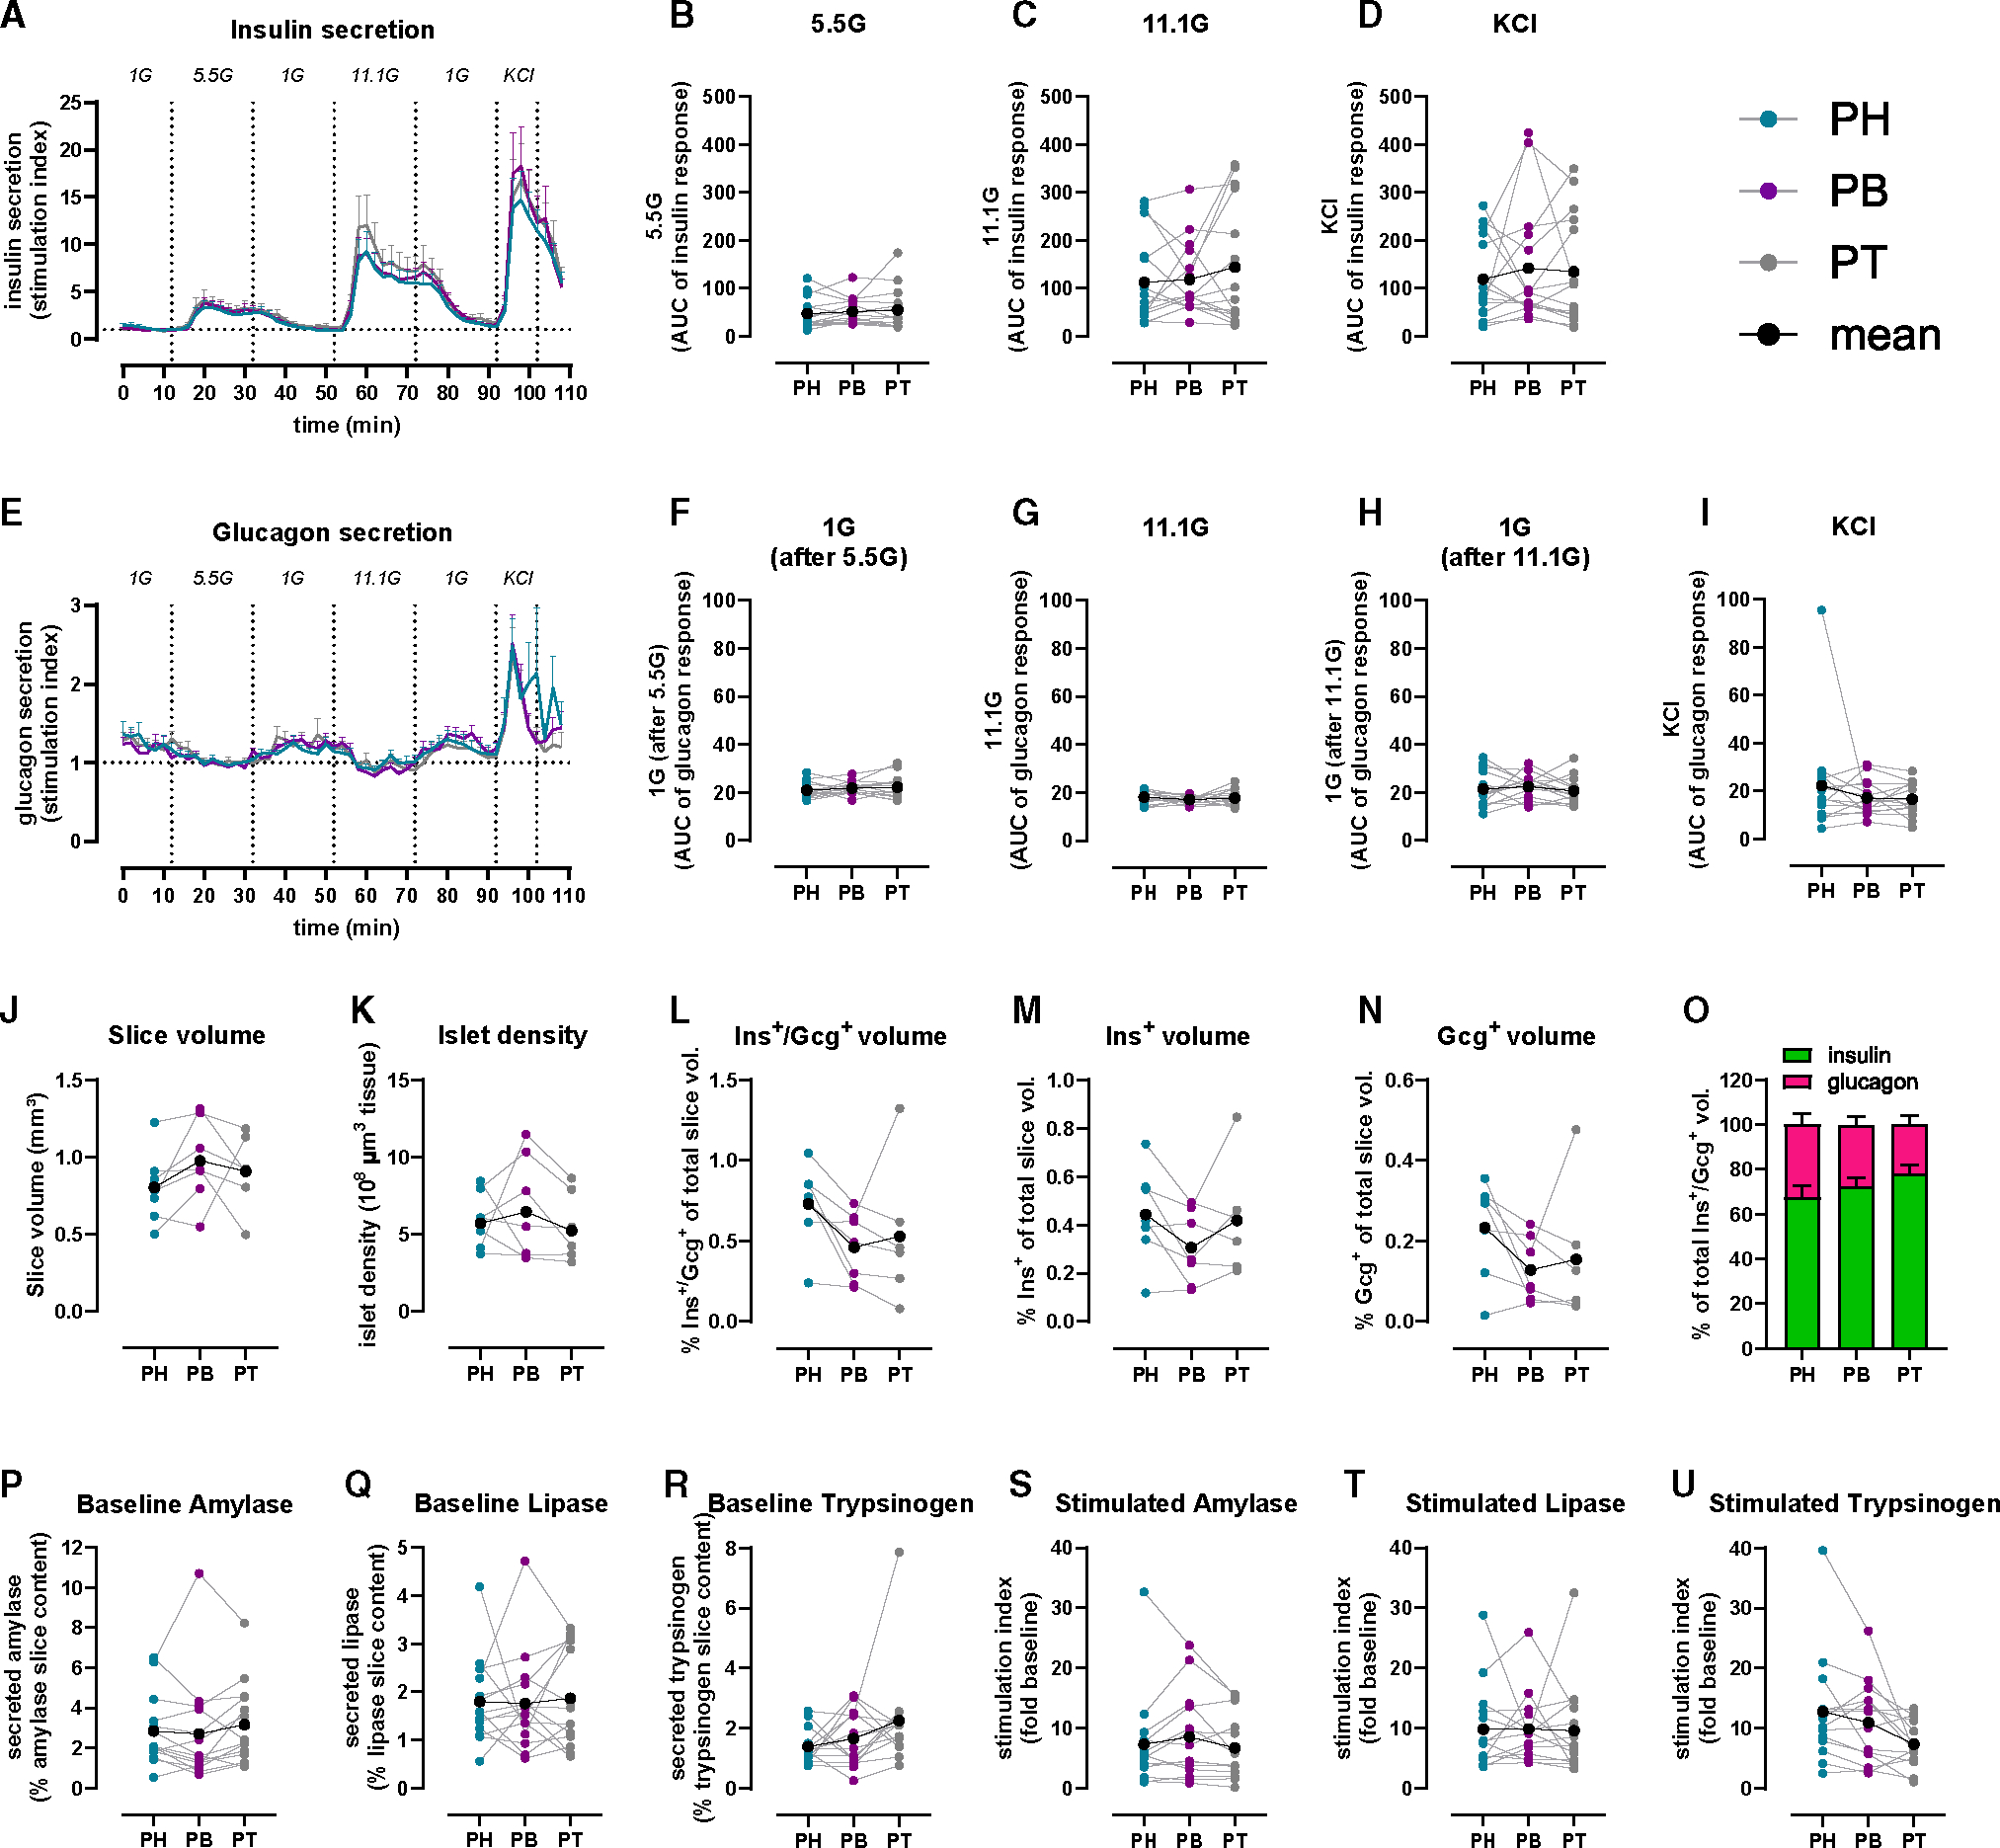
Figure 1. Similar islet and acinar cell secretion across the PH, PB, and PT in ND human pancreas.

(A and E) Insulin (A) and glucagon (E) secretion traces from PH (teal), PB (purple), and PT (gray) slices shown as stimulation index (fold of baseline: 1G for insulin, 5.5G for glucagon).
(B–D) Quantification of insulin responses to 5.5G (B), 11.1G (C), and KCl (D).
(F–I) Quantification of glucagon responses to 1G (F), 11.1G (G), 1G (H), and KCl (I).
(J–O) 3D morphometry of perifused slices showing slice volume (J), islet density (K), endocrine (L), insulin (M), and glucagon (N) volumes and the contribution of insulin and glucagon to total endocrine volume (O).
(P–R) Baseline pancreatic amylase (P), lipase (Q), and trypsinogen (R) release expressed as a percentage of total enzyme content.
(S–U) Carbachol-stimulated amylase (S), lipase (T), and trypsinogen (U) secretion expressed as stimulation index (fold of baseline).
n = 15 ND donors (A–I), 7 ND donors (J–O), with 4 slices/region/donor, and 14 ND donors (P–U) with 5 slices/region/donor. Dots represent individual donors with means shown in black. Data are represented as mean ± SEM with repeated measures (RM) one-way ANOVA of log-transformed data.
