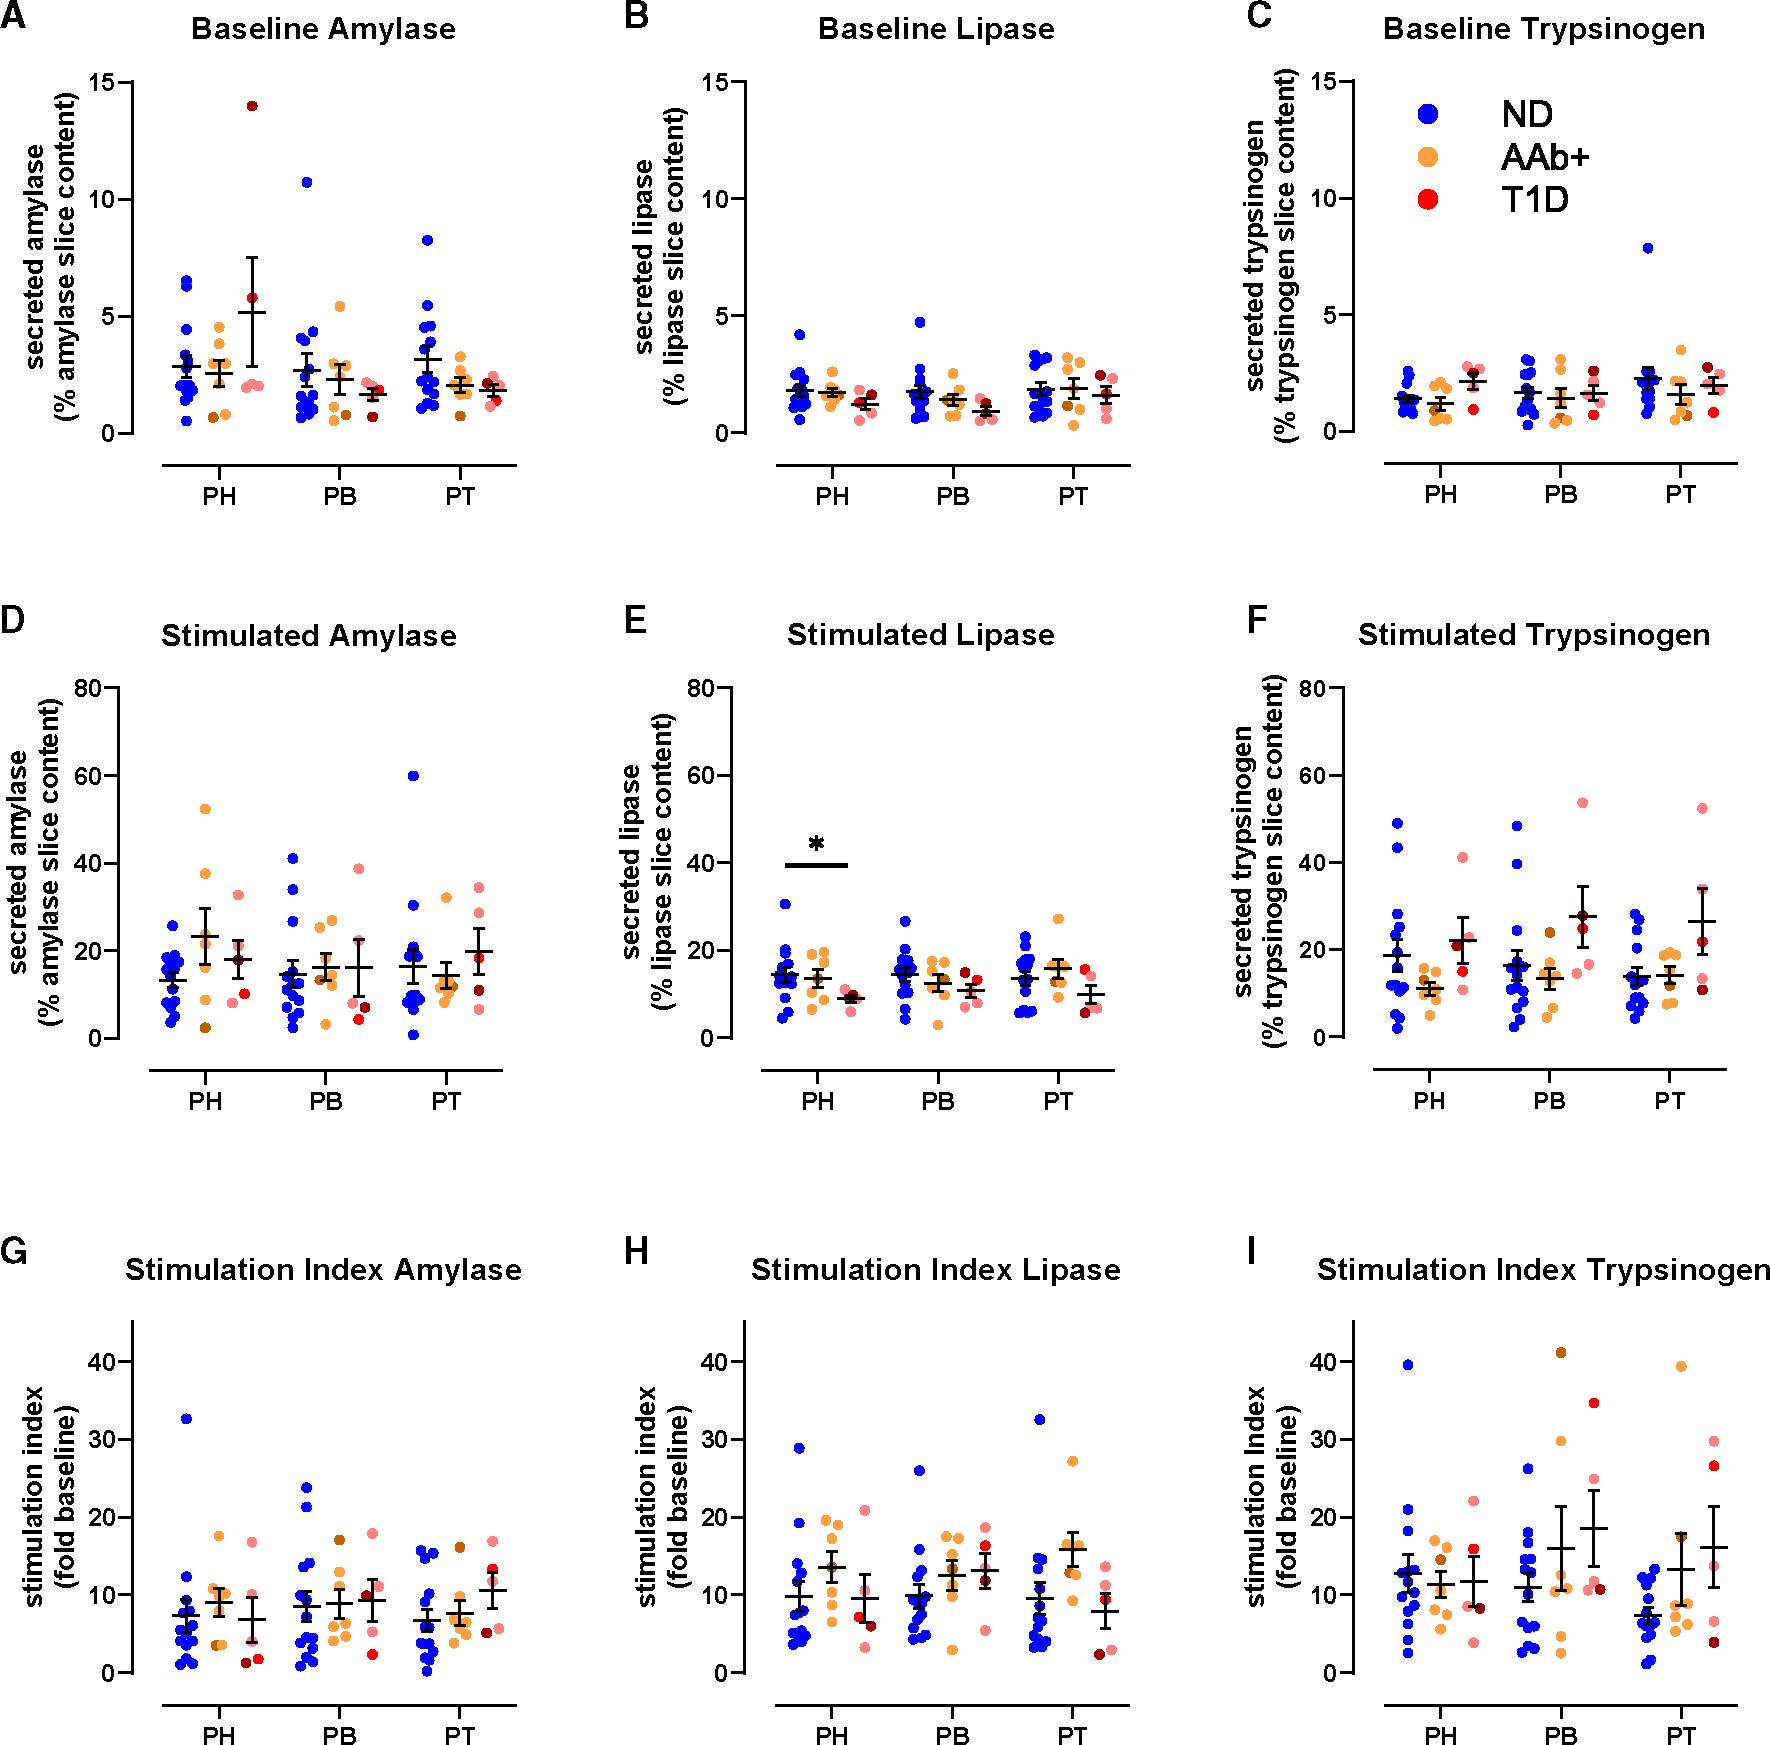
Figure 3. Preserved acinar cell function at T1D onset.

(A–C) Baseline pancreatic amylase (A), lipase (B), and trypsinogen (C) release in ND, 1AAb+, and T1D slices from PH, PB, and PT expressed as a percentage of total enzyme content.
(D–F) Carbachol-stimulated amylase (D), lipase (E), and trypsinogen (F) secretion in ND, 1AAb+, and T1D slices from PH, PB, and PT expressed as a percentage of total enzyme content.
(G–I) Carbachol-stimulated amylase (G), lipase (H), and trypsinogen (I) secretion in ND, 1AAb+, and T1D slices from PH, PB, and PT expressed as stimulation index (fold of baseline).
n = 14 ND, 7 1AAb+, and 5 T1D donors with 5 slices/region/donor. Dots represent individual donors shown with mean ± SEM and RM two-way ANOVA. *p < 0.05.
