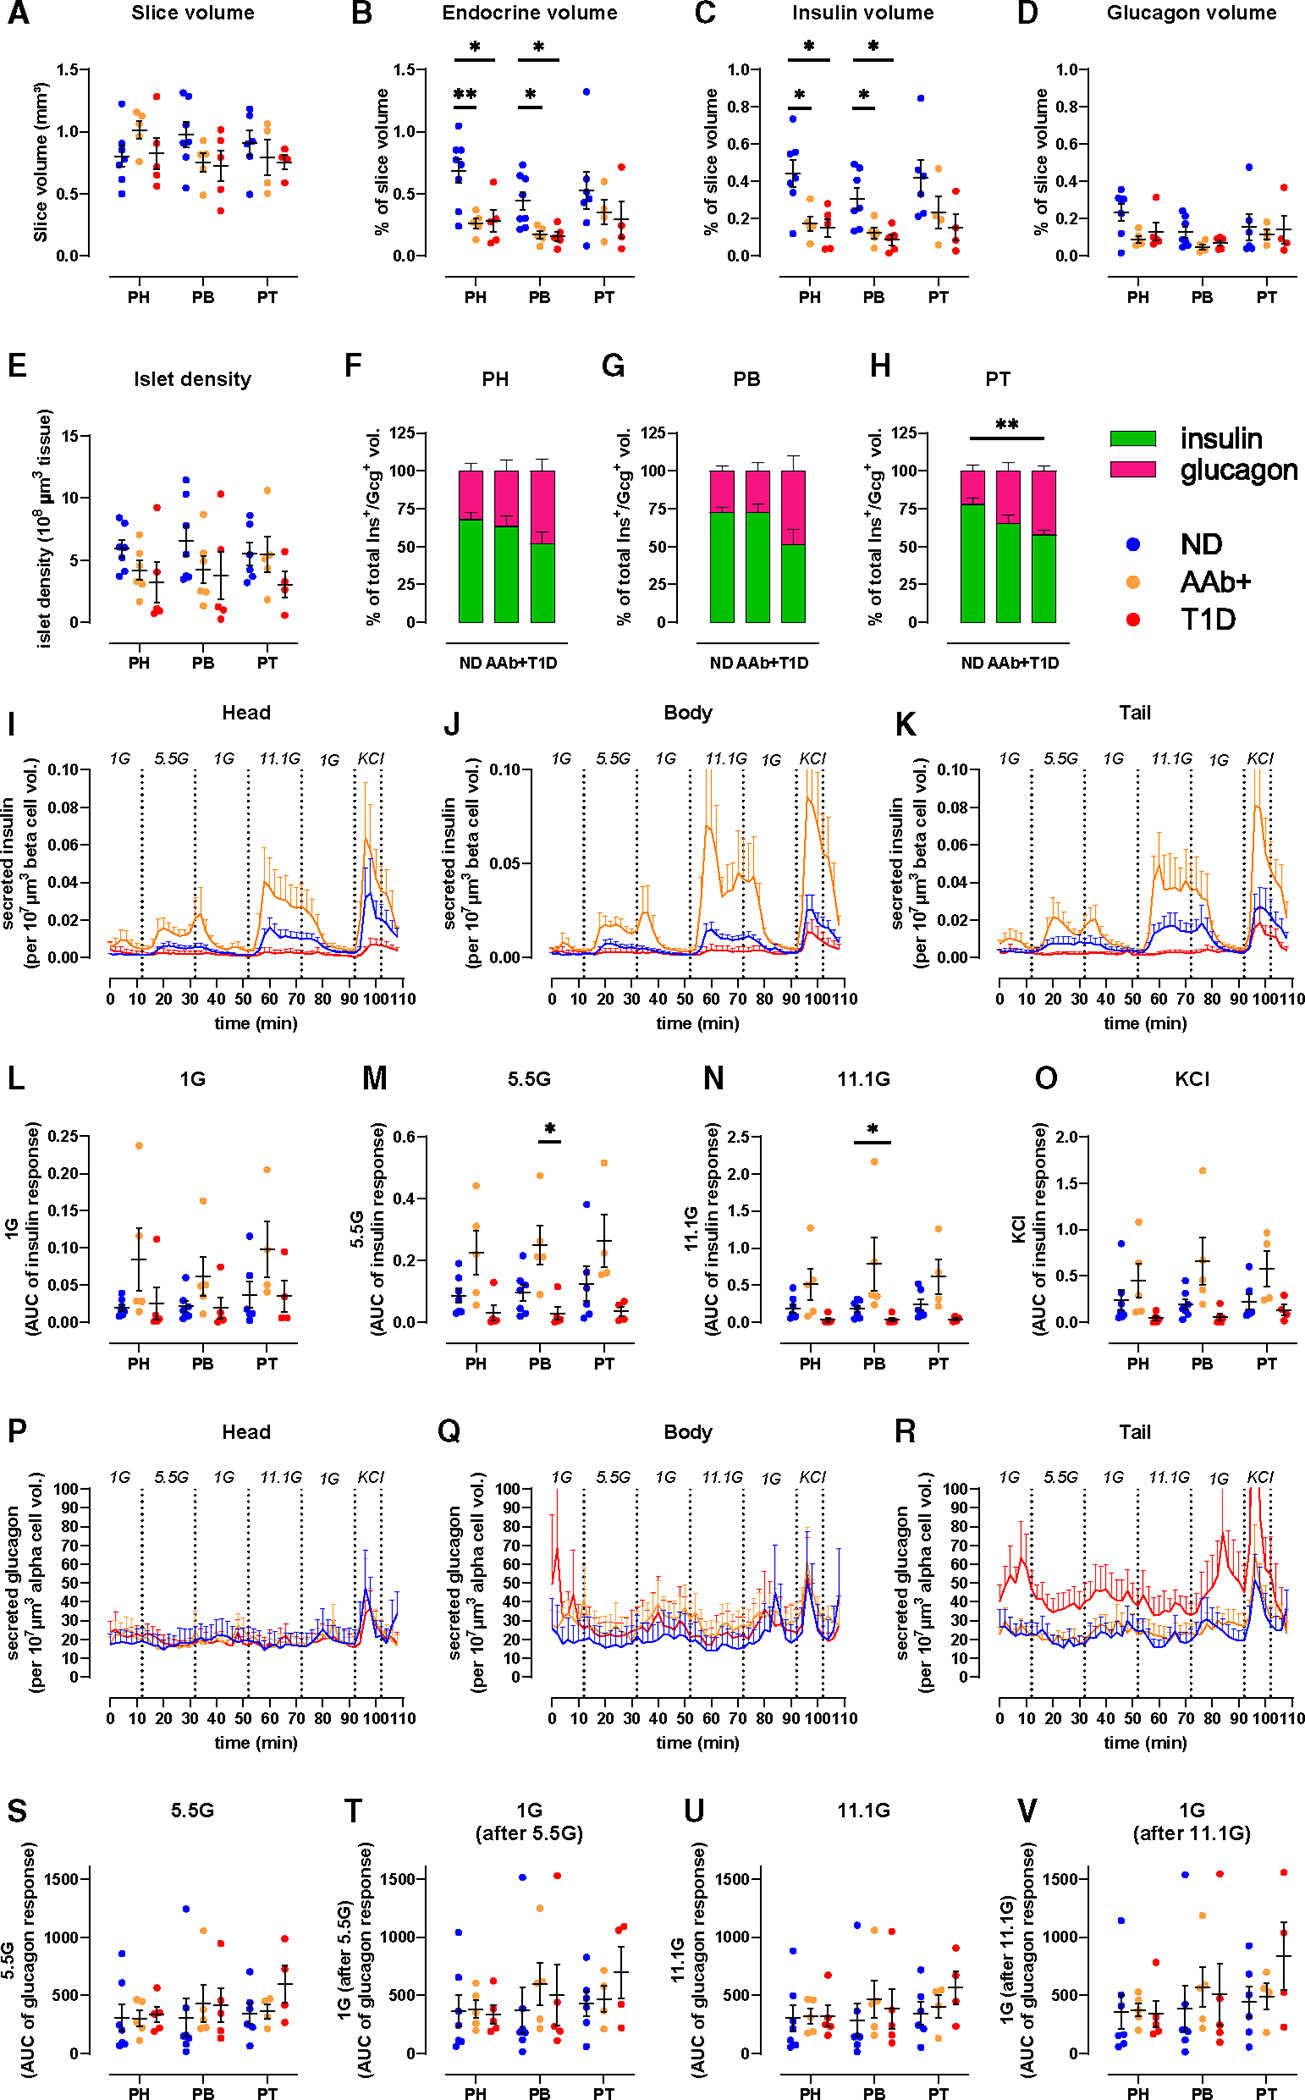
Figure 4. Decreased endocrine and beta-cell mass across the pancreas at T1D onset.

(A–H) 3D morphometry of perifused slices showing whole-slice (A), endocrine (B), insulin (C), and glucagon (D) volumes, islet density (E), and the contributions of insulin and glucagon to total endocrine volume across disease groups in PH (F), PB (G), and PT (H).
(I–K) Insulin secretion traces from slices of PH (I), PB (J), and PT (K) from ND, 1AAb+, and T1D shown as secreted insulin normalized to respective beta-cell volume.
(L–O) Quantification of insulin responses to 1G (L), 5.5G (M), 11.1G (N), and KCl (O).
(P–R) Glucagon secretion traces from slices of PH (P), PB (Q), and PT (R) from ND, 1AAb+, and T1D shown as secreted glucagon normalized to respective alpha-cell volume.
(S–V) Quantification of glucagon responses to 5.5G (S), 1G (T), 11.1G (U), and 1G (V).
n = 7 ND, 5 1AAb+, and 5 T1D donors with 4 slices/region/donor. Dots represent individual donors with mean ± SEM and RM two-way ANOVA of log-transformed data. *p < 0.05 and **p < 0.01.
See also Figure S4.
