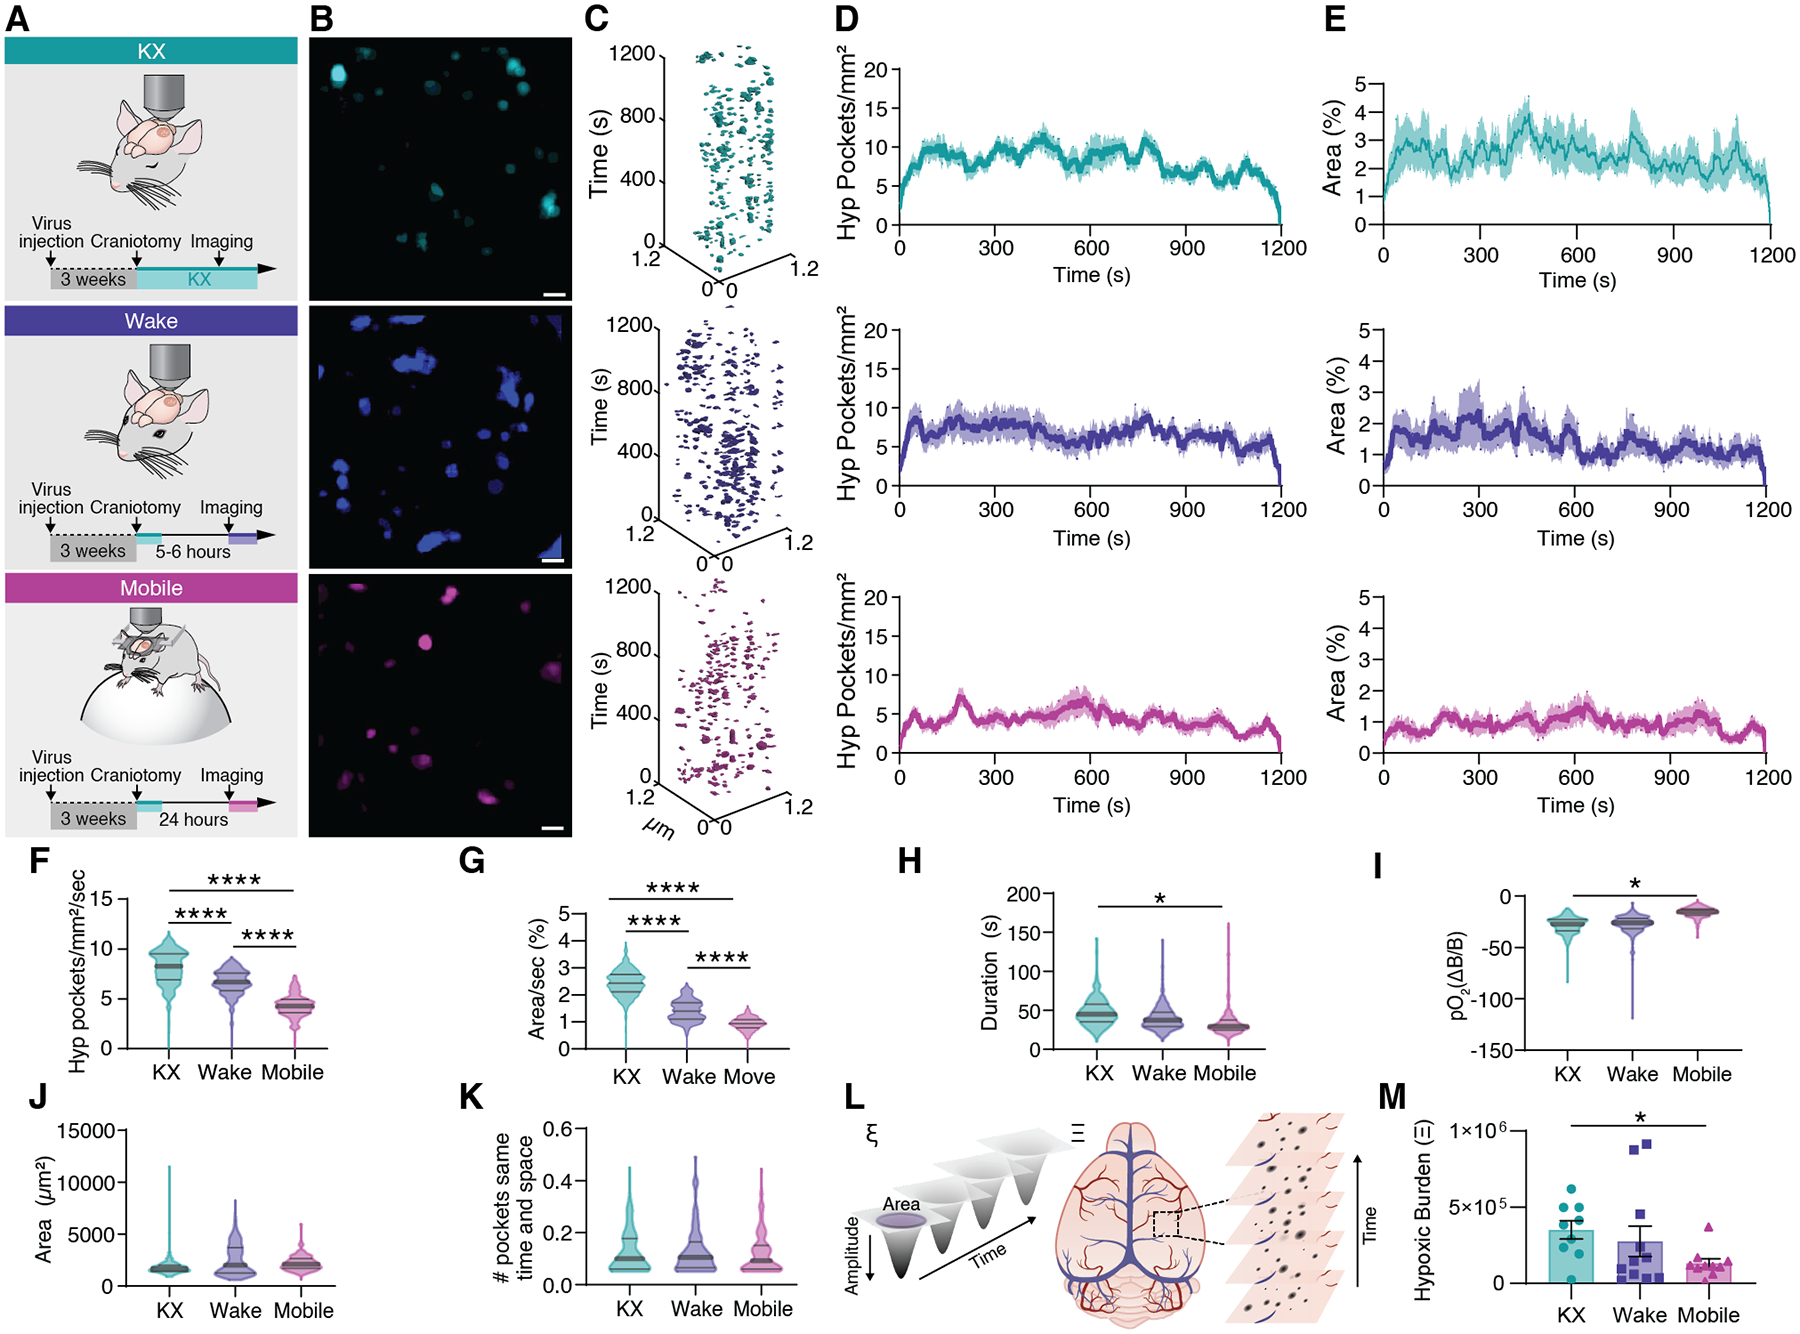
Fig. 4. Increased arousal level suppresses tissue hypoxia.

(A) Cerebral pO2 was either measured in KX anesthetized mice, awake head-fixed mice during quiet wakefulness in a MAG-1 mouse holder or in mobile mice voluntarily running on a Styrofoam sphere. (B) Distribution of hypoxic pockets in a single recording session covering 20 minutes. (C) Hypoxic Pockets identified in B in the form of regions of interest over time displayed in an x-y-t 3D rendering. Turquoise regions denote signal. (D) Average number of hypoxic pockets detected for each frame in mice during KX anesthetized, wakefulness and mobile wakefulness, respectively. (E) Average area hypoxic pockets cover in the field of view in % detected for each frame in mice during KX anesthesia, wakefulness, and mobile wakefulness, respectively. (F) Frequency distribution of number of hypoxic pockets. (G) Frequency distribution of area covered by hypoxic pockets in the field of view per second. (H) Frequency distribution of duration of hypoxic pockets. (I) Frequency distribution of amplitude of hypoxic pockets. (J) Frequency distribution of size of hypoxic pockets. (K) Frequency distribution of number of hypoxic pockets sharing the same region per second. (L) Schematic illustrating the parameters used to calculate the hypoxic burden for each hypoxic pocket (left; ξ), and for an entire recording/mouse (right; Ξ). (M) Hypoxic burden during KX anesthesia, wakefulness, and mobile wakefulness. N = 9 mice KX, 11 mice wake, 10 mice mobile; Means ± SEM are shown. SEM = standard error of the mean. Violin plots show median and quartiles. Bars indicating Tukey’s post-hoc tests between groups at their edges: *: P < 0.05, P < 0.01, ***: P < 0.001, ****: P < 0.0001. Scale bars, 100 μm.
